


Europe
Asia Pacific
North America
South America
Middle East
South Africa
Executive Summary
The container market enters the fourth quarter split in two. On the Transpacific, Xeneta market average spot rates reached USD 7,960 per FEU from the Far East to the US West Coast and USD 11,259 per FEU to the US East Coast on 17 September, both up about 324% since the pre-Hormuz level of 28 February and only 17.9% and 11.2% below their Covid-19 records. Europe shows the opposite picture, with Far East to North Europe at USD 4,103 per FEU and Far East to Mediterranean at USD 4,434 per FEU, extending a decline that started in July. North Europe to US East Coast holds firm at USD 2,956 per FEU.
Three forces drive this divergence: carrier capacity management rather than demand, typhoon congestion at Shanghai and Ningbo that pushed global on-time performance to 29.4% in August, and the Middle East, where Hormuz has been effectively closed for over six months while returning Red Sea capacity loosens Asia-Europe supply.
Key takeaways: Asia to US remains the highest short-term cost risk. Asia-Europe base rates are falling, but Northern European hinterland problems keep door-to-door costs high. Fuel and surcharges are now the most dynamic part of every freight invoice.
Global Economic & Trade Context
US demand has outperformed expectations. NRF now forecasts September imports at 2.31 million TEU, up 9.6% year on year and the busiest month of 2026, before easing to 2.11 million TEU in October, noting that consumers keep buying despite tariffs, inflation and high fuel prices.
Energy is the key macro variable. Brent closed at USD 103.49 per barrel on 23 September. The EIA weekly US diesel price hit a record USD 6.285 per gallon for the week of 14 September, above USD 8 in California, with inventories about 13% below the five-year average.
Hormuz traffic has dwindled to a trickle, with Reuters counting 17 commodity vessel transits over the weekend of 19 to 20 September, down from 37 a week earlier. In the Red Sea, Houthi forces seized a port and island on the Bab el-Mandeb and struck the Saudi East-West pipeline, yet carriers keep expanding Suez transits.
A second chokepoint is tightening: the Panama Canal cut daily transits to 32 from 15 September, with a Neopanamax draft of 47.5 feet scheduled from 1 October, citing drought and El Niño risk into 2027.
Container Freight Market Analysis
Spot Rate Developments
| Index / Lane | Latest figure + date | Direction / interpretation |
| Xeneta Far East - US West Coast | USD 7,960/FEU (17 Sep) | Up from USD 7,496 on 3 Sep; 17.9% below Covid peak |
| Xeneta Far East - US East Coast | USD 11,259/FEU (17 Sep) | Up from USD 10,910 on 3 Sep; 11.2% below USD 12,683 record |
| Xeneta Far East - North Europe | USD 4,103/FEU (17 Sep) | Down from USD 4,532 on 3 Sep; seasonal decline plus Red Sea capacity |
| Xeneta Far East - Mediterranean | USD 4,434/FEU (17 Sep) | Down from USD 5,073 on 3 Sep; fastest Suez return |
| Xeneta North Europe - US East Coast | USD 2,956/FEU (17 Sep) | Firm; +100% vs 28 Feb |
| Xeneta China - Jeddah | USD 10,870/FEU (10 Sep) | +256% vs 28 Feb; above Covid record |
| Xeneta China - Khor al Fakkan | USD 10,626/FEU (10 Sep) | +479% vs 28 Feb; above Covid record |
| Xeneta short-term, Far East - ECSA | USD 8,733 (25 Aug) to 7,699 (1 Oct) | -11.8%; correction after August spike |
| Xeneta short-term, North Europe - ECSA (OTHC) | USD 726 (25 Aug) to 994 (1 Oct) | +36.9%; backhaul firming from low base |
| Drewry WCI Composite | USD 4,500/FEU (17 Sep) | +1% w/w; stable for three weeks |
| Drewry Shanghai - Los Angeles | USD 7,712/FEU (17 Sep) | +5% w/w |
| Drewry Shanghai - New York | USD 10,394/FEU (17 Sep) | +7% w/w |
| Drewry Shanghai - Rotterdam | USD 3,626/FEU (17 Sep) | -9% w/w |
| Drewry Shanghai - Genoa | USD 4,016/FEU (17 Sep) | -5% w/w |
| Drewry Intra-Asia Index | USD 1,402/FEU (17 Sep) | +6% w/w; congestion-driven |
Freightos confirms the direction: in the week to 15 September, FBX Asia-North Europe fell 3% to about USD 4,300 and Asia-Mediterranean 12% to about USD 4,200, while Transpacific lanes ticked up again.
Carrier Strategies
FAK: Hapag-Lloyd will raise FAK tariffs from the Far East to North Europe, the Mediterranean, the Adriatic and the Black Sea from 19 October, a first attempt to stop the Asia-Europe slide.
Blank sailings: Drewry counts 77 blank sailings out of 720 planned East-West departures in weeks 39 to 43, about 11%, concentrated on the Transpacific. Meanwhile, offered capacity into the US East Coast rose 6 to 7% in September as carriers harvest peak rates.
Allocation control and rollings: Congestion at Shanghai and Ningbo means omitted calls, tighter allocations and more rollings, while shippers increasingly challenge surcharges rather than accepting them.
Breakbulk & Project Cargo Segment
The multipurpose market remains far calmer than containers. Toepfer's TMI stands at USD 12,832 per day for September and the new TMI 500 at USD 17,669 per day, within a long-running USD 12,000 to 13,000 band. Beneath the stable headline, availability is tightening: Toepfer's Market Sentiment Index reached 54.7, its highest since 2022, with participants reporting tighter tonnage in Asia and uneven fleet positioning. Project demand signals, such as a reported 8.5 GW UK offshore wind tender, remain constructive.
OOG angle: Flat racks and open tops carry the same PSS and emergency surcharges as dry boxes, and OOG units are the first to suffer when congested vessels cut calls or restow. With Transpacific container rates near records while MPP charter rates are flat, breakbulk and MPP options should be benchmarked against containerised OOG for North America and the Gulf. MPP lead times out of Asia are lengthening, so Q4 and Q1 project space needs earlier fixing.
Regional Insights – Deep Dive
Ocean freight trends - Europe
Main Market Trend
Europe is the softest major import market. Drewry's Shanghai to Rotterdam fell 9% in one week to USD 3,626 per FEU, and Xeneta showed North Europe down 18% and the Mediterranean down 28% between early July and early September.
Returning Red Sea capacity is the structural driver. Sea-Intelligence estimates more than a quarter of Asia-Europe capacity sails via the Red Sea in September, including 35% of Asia-Med headhaul but only 6% of Asia-North Europe headhaul. Maersk and Hapag-Lloyd have moved four more joint services to Suez, while MSC's return carries a reversibility clause.
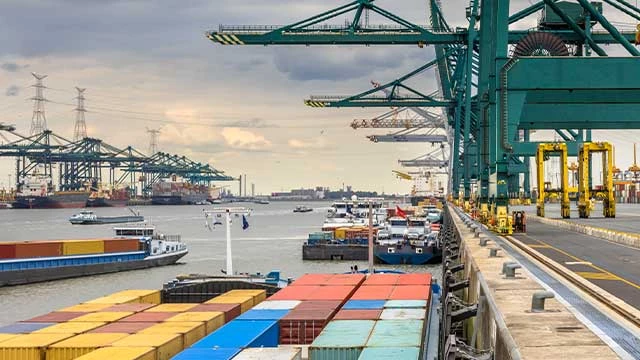
Main Reasons for Bottlenecks
The bottleneck has moved inland, especially linked the fact of the Rhine water levels for voyages to Switzerland and southern German. Market reports that securing a truck can take two weeks and a rail slot up to six weeks, pushing some importers toward Hamburg, Bremerhaven, Koper or Trieste.
Impact on Freight Rates
Port-to-port rates are falling or stable, but door-to-door costs into southern Germany, Switzerland and Austria are rising through low-water surcharges, road and rail premiums, and demurrage and detention in crowded terminals.
Rate impact: Base rates drift toward the seasonal low after Golden Week, with Hapag-Lloyd's 19 October FAK the first test of a floor. Hinterland costs stay high until substantial rain restores the Rhine.
Ocean freight trends - Asia Pacific
Main Market Trend
Asia is where the global capacity squeeze originates. Bookings are peaking ahead of Golden Week from 1 to 7 October, intra-Asia rates are firming, and Linerlytica expects backlogs to keep ships full even through the holiday, which would be unusual.
Asia shipping remains firm but fragmented. Demand is weakening post-peak season, while congestion, capacity management, weather, and geopolitical risks continue to support rates.
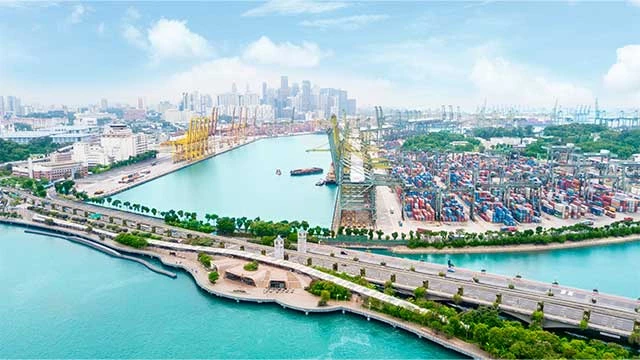
Main reason for bottlenecks
Typhoon Saudel closed Ningbo for 78 hours and Shanghai's Yangshan and Waigaoqiao terminals for 54 and 48 hours. Linerlytica estimated on 8 September that more than 4 million TEU of capacity is absorbed by congestion, with waits of up to 12 days at Shanghai and Ningbo. Yard utilisation at Ningbo's MSICT exceeds 90%, and Far East to Europe on-time performance fell from 47% in mid-June to 3% by the end of July.
Key Pressure Points
- Congestion and typhoons disrupt major Asian ports.
- Vessel bunching and schedule reliability remain issues.
- Middle East tensions add routing and cost uncertainty.
Impact on Freight Rates
At origin, delays mean extra depot handling, truck waiting time and missed cut-offs. Ocean rates ex Asia stay supported wherever congestion removes effective capacity, which is why even softening Asia-Europe rates remain well above pre-crisis levels.
Rate impact: Firm until congestion clears. Long-haul trades should soften after Golden Week, intra-Asia much less so.
Freight Outlook
- Asia-US: Volatile; potential softening after peak season.
- Asia-Europe: Downward pressure, but geopolitical risks could reverse the trend.
- Intra-Asia: Firm through October, then potentially stabilizing.
- Asia-Middle East: Highly volatile and uncertain.
Ocean freight trends - North America
Main market trend
The US peak season has run far longer than expected, with September set to be the busiest import month of the year. Rates sit at their highest since the pandemic as carriers test how far shippers will pay before volumes turn in October.
Main reason for bottlenecks
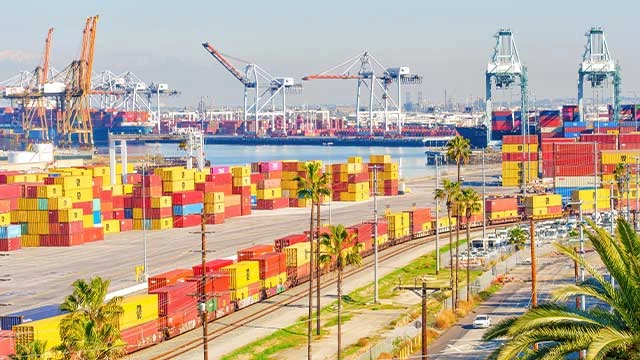
The problems start in Asia, where typhoon-delayed departures arrive in bunches and compress port and rail windows. All-water services to the East and Gulf Coasts face the Panama Canal transit cap and surcharges. Inland, the constraint is cost: diesel is at record levels and truckload tender rejections stood near 13.6% in early September, well above the 10 to 11% seen at the start of the year.
Impact on Freight Rates
Door to door, a 40ft from Shanghai to an inland US destination combines spot ocean rates of USD 8,000 to 11,000, PSS of up to USD 4,000 from 1 October and rising fuel surcharges on drayage and linehaul.
Rate impact: One more push into early October, then a plateau. The East Coast remains the lane most likely to break its record if fuel rises further.
Ocean freight trends - South America
Main market trend
After the August spike, South America is correcting. Xeneta short-term rates from the Far East to the East Coast move from USD 8,733 on 25 August to USD 7,699 on 1 October, down 11.8%. New capacity is arriving through ZIM's Falcon Service to the East Coast and CMA CGM's revamped PEX2 with a direct call at Puerto Antioquia. The backhaul from North Europe is firming from a low base, up 36.9%.
Main reason for bottlenecks
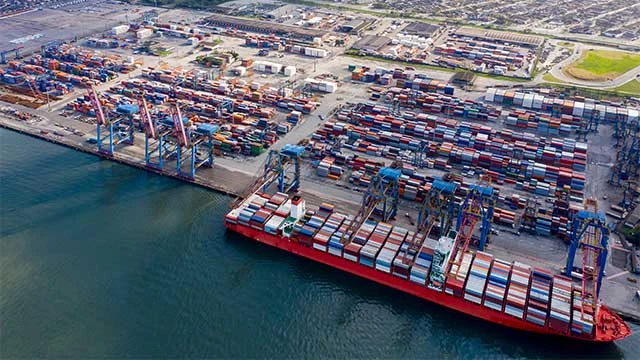
Origin congestion in China delays long Asia-South America loops, and a rolled box in Shanghai can lose a full week. For West Coast and Caribbean flows, the Panama Canal cap raises delay risk at transshipment hubs. Fuel is expensive locally, with Santos VLSFO at USD 850.50 per tonne.
Impact on Freight Rates
Base rates are easing, but PSS and fuel components stay high and inland costs track fuel, so door-to-door budgets fall less than headline spot rates suggest.
Rate impact: Further moderate easing on Asia-ECSA as new services add capacity, while Europe-ECSA firms.
Ocean freight trends - Middle East
Main market trend
The region runs on workarounds. With Hormuz effectively closed, land bridges via Jeddah and Khor al Fakkan are the established route into the Gulf. Xeneta calls this stable but costly, with China to Jeddah at USD 10,870 per FEU and China to Khor al Fakkan at USD 10,626 per FEU on 10 September, both above Covid records. Bab el-Mandeb capacity doubled year on year in August but still sits at only 23% of August 2023 levels.
Main reason for bottlenecks
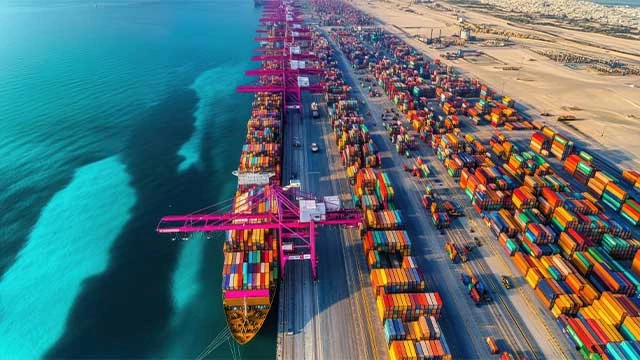
The land bridge leg is the constraint, from trucking capacity to customs handovers and feeder links. Bookings have partly suspended to most Upper Gulf ports and trucks cargo from Fujairah and Khor al Fakkan to Jebel Ali. The latest Houthi advances show how quickly Red Sea conditions can change.
Impact on Freight Rates
Door to door, Gulf-bound cargo pays record ocean rates to the land bridge port, emergency surcharges and the inland leg. Fujairah is also the most expensive major bunker hub, feeding regional fuel surcharges.
Rate impact: No relief while Hormuz stays closed. A reopening would trigger a sharp correction, but there is no diplomatic signal to plan around yet.
Ocean freight trends - South Africa
Main market trend
South Africa remains on the main East-West path because most Asia-North Europe capacity still routes around the Cape. The dominant story is the crisis at Durban Gateway Terminal, formerly Pier 2, which handles more than 40% of the country's container traffic.
Main reason for bottlenecks
After the switch to a new Navis N4 terminal system in mid-August, industry associations reported a 26% drop in weekly throughput, and some lines reported waits of eight to 12 days.
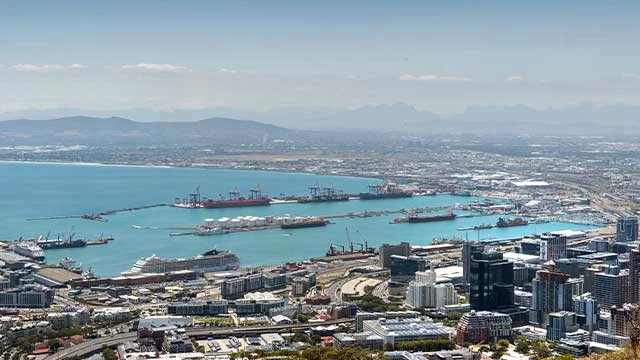
Truck queues on Bayhead Road were documented on 16 September, and TNPA cited ageing infrastructure, equipment failures and weak rail links on 22 September. The issue has been escalated to the Presidency.
Impact on Freight Rates
The cost impact is landside. Containers held beyond free time generate storage and demurrage, and hauliers pass on waiting time.
Rate impact: Ocean rates are secondary. Budget for storage, detention and possible congestion surcharges until throughput recovers.
Operational Insights
Port congestion and dwell: Shanghai and Ningbo remain the global pressure point, while Northern Europe and Durban are constrained landside. Xeneta's departure-based on-time performance for August was 29.4% globally, with Gemini at 51.8%, Ocean Alliance at 27.7%, MSC at 26.0% and Premier Alliance at 15.8%. Sea-Intelligence's arrival-based measure fell to 56.4% in July, the lowest of 2026, with late vessels averaging 6.06 days behind schedule.
Bunker prices (Ship & Bunker, 23 September 2026, USD per tonne):
- Singapore: VLSFO 859.50, MGO 1,328.50
- Rotterdam: VLSFO 691.00, MGO 1,465.00
- Houston: VLSFO 746.00, MGO 1,413.50
- Fujairah: VLSFO 982.00, MGO 1,686.00
- Santos: VLSFO 850.50, MGO 1,558.00
- Global average: VLSFO 918.50, MGO 1,613.00
Surcharge implications: Fujairah VLSFO trades about USD 290 above Rotterdam, reflecting Gulf supply stress. Freightos estimates bunker costs about 60% above pre-war levels, and Europe-bound voyages also carry EU ETS costs, with EUAs at EUR 86.65, roughly USD 321 per tonne of VLSFO burned. With carriers resetting fourth quarter bunker tariffs, BAF and emergency fuel surcharges are likely to rise from 1 October regardless of base-rate direction.
Market Outlook & Strategic Recommendations
Base scenario: Transpacific rates rise once more in early October as cargo is rushed out before Golden Week, then plateau or ease modestly. NRF's forecast of a roughly 9% volume drop from September to October supports a turn, but congestion and blank sailings keep a high floor. Asia-Europe continues toward its seasonal low, and the 19 October FAK increases will likely only partially stick.
Upside scenario: Red Sea escalation reverses Suez returns, and together with further typhoons or a bunker spike, Far East to US East Coast exceeds its USD 12,683 record while Asia-Europe rebounds quickly.
Downside scenario: China congestion clears after Golden Week just as US demand falls and Red Sea transits accelerate, triggering a sharp Transpacific correction and further Asia-Europe declines. A Hormuz reopening would add a steep correction on Gulf trades.
Key Takeaway
This market is driven by capacity, fuel and geopolitics rather than demand. Winners manage total landed cost, secure capacity by service with realistic reliability assumptions and challenge surcharges line by line. Losers buy headline rates by lane and discover the true cost in rollings, surcharges and inland delays.
Customer advice
October rewards early decisions. If you ship from Asia to North America consider holding flexible cargo until late October while keeping space options open with more than one carrier. Before accepting new peak season surcharges from 1 October, compare the all-in price with index references, as several carriers are not filing October increases at all.
In Europe, the opportunity is the ocean leg, but this window will close very soon and the risk is the hinterland. Use current rate weakness to secure fourth quarter and early 2027 volumes, but reserve rail and truck capacity weeks ahead for southern Germany, Switzerland and Austria, and negotiate extended free time, since demurrage and detention now pose a larger threat than freight rates.
For the Gulf, plan with the land bridge as the base case and allow for longer transits. For South Africa, prepare documents early and arrange collection before vessels arrive so containers leave Durban within free time.
For project and out-of-gauge cargo, compare every containerised OOG quotation with a breakbulk or MPP alternative, and fix fourth quarter vessel space early while multipurpose sentiment is at its strongest since 2022. Our project and container teams are ready to run these comparisons with you shipment by shipment.
Disclaimer: This report is based on publicly available market intelligence and represents analysis as of 30 September 2026. Forward-looking statements reflect base-case assumptions and are subject to risks outlined in the Market Outlook section. Actual market conditions may vary. For questions or custom analysis, contact Bertling Market Intelligence.


