


Europe
Asia Pacific
North America
South America
Middle East
South Africa
Executive Summary
Container freight markets have entered a technical correction after a spike-driven peak season that began two months ahead of the seasonal norm. Spot rates on major ocean container shipping trades from Far East to US and Europe have slightly softened, in a sign the triple-digit percentage spikes caused by the Middle East conflict appear to have peaked¹, with Far East to US West Coast down 5% week-on-week and Mediterranean down 2%, while US East Coast and North Europe are both down 1%, with further decreases expected². The Drewry World Container Index declined 2% to $4,547 per 40ft container as of 16 July, marking the first retreat after ten weeks of consecutive gains.
Market drivers: The frontloading phenomenon is central to the narrative. Shippers pulled forward volumes at the start of peak season. This frontloading contributed to a capacity squeeze that then pushed spot rates higher than they likely would have been otherwise. Peak season effectively started in May this year rather than July⁵. Capacity injection by carriers (MSC Pearl service reinstated June, Yang Ming and ONE extra-loaders) is beginning to relieve pressure but has arrived after the demand surge, not before it. The Strait of Hormuz remains effectively closed to commercial container traffic, with diversion costs embedded in all eastbound and westbound Far East pricing. A new operational threat emerged on 20 July when Iran-backed Houthi rebels declared a complete naval blockade on Saudi Arabia⁶, compounding Red Sea routing risk.
Key takeaways: The market has peaked on an artificial demand pull, not structural strength. The correction is now underway. Without underlying demand growth or continued network disruption, softening should accelerate into Q3. Project and breakbulk carriers have benefited from tight container capacity over the last 8 weeks but should not expect this to persist.
Global Economic & Trade Context
As of 22 July, only 15 ships transited on July 19 versus ~88 ships per day under normal conditions; the Strait of Hormuz is effectively closed to commercial shipping⁸. Container lines have not returned to Suez routing; the political risk remains high, and carriers have instead locked in longer cycle times and higher fuel burn to avoid Red Sea/Bab el-Mandeb, as on July 20, Iran-backed Houthi rebels declared a complete naval blockade on Saudi Arabia⁹. The announced blockade targets Saudi Arabian vessels and complicates further any container line attempt to rationalize routing and will most probably affect as well breakbulk vessels entering the Red sea.
The US tariff environment remains unsettled and new tariffs have been announced. Although spot tariff proposals have moderated since early 2026, uncertainty itself depresses shipper confidence.
Trade policy regionally: the European Union's Emissions Trading System (ETS) expansion continues to add structural cost to Asia-Europe routes. Shippers are absorbing carbon premiums estimated at $150–$400 per container, a drag that will persist and deepen as compliance obligations tighten through 2027.
Container Freight Market Analysis
Spot Rate Developments
|
Index / Lane |
Latest public figure |
Direction / interpretation |
Commentary |
|
Xeneta FE–US West Coast |
$6,272 USD/FEU (16 Jul) |
↓ 5% WoW |
Down from $6,606 previous week; +252% vs pre-Hormuz (28 Feb). Capacity injections beginning to relieve but rates remain historically elevated. |
|
Xeneta FE–US East Coast |
$7,879 USD/FEU (16 Jul) |
↓ 1% WoW |
Soft decline week-on-week; +230% vs pre-crisis. Transpacific East Coast demand remains firm but frontloading subsiding. |
|
Xeneta FE–North Europe |
$5,377 USD/FEU (3 Jul) |
↓ 1% WoW |
Moderation signal; +144% vs end-Feb baseline. Asia-Europe spread tightens as carriers manage capacity. |
|
Xeneta FE–Mediterranean |
$6,772 USD/FEU (3 Jul) |
↓ 2% WoW |
Mediterranean continuing to soften as empty repositioning eases. +102% vs pre-crisis. |
|
Drewry WCI composite |
$4,547 USD/FEU (16 Jul) |
↓ 2% WoW |
First decline after 10 consecutive weeks up. Index reached $4,639 on 9 Jul (highest since Sep 2024). |
|
Shanghai to Los Angeles |
$6,272 USD/FEU (16 Jul) |
↓ 3% WoW |
Mild softening; reflects spot market reality. Carriers testing $6,000–$6,500 range for August. |
|
Shanghai to New York |
$7,879 USD/FEU (16 Jul) |
↓ 1% WoW |
Stickiness on US East Coast reflects congestion at destination ports (NY/NJ 2–5 day waits). |
|
Intra-Asia (IACI) |
$978 USD/FEU (16 Jul) |
↓ 1% WoW |
Weakest regional index; feeder traffic softer as mainline services tighten. |
Context: All rates remain substantially above 2024 benchmarks. The softening observed in mid-July is a technical correction, not a structural reversal. Spot rates from Far East to US West Coast and US East Coast still sit at +276% and +232% respectively since the end of February¹¹. The magnitude of the spike guarantees that even a 5% retreat still leaves shippers paying multiples of what they budgeted at the start of the year.
Carrier Strategies: Surcharges, Capacity, and Allocation Control
Carriers remain in an aggressive revenue-capture mode, offsetting softening spot rates through layered surcharges and FAK ceiling-setting to avoid fast dropping spot rates.
These surcharges are layered on top of base FAK and long term rates, creating opaque total-cost structures. Nonetheless, current outlook for outbound Asia trades will show lower total rates, as the volume peak seems to be over.
Blank sailings and capacity allocation:
- 39 blank sailings are expected over the next five weeks, from week 30 (20–26 July) to week 34 (17–23 August)¹⁵. This is significantly higher than seasonal norms and signals carriers' intention to manage supply and defend pricing as demand naturally softens post-peak.
Breakbulk & Project Cargo Segment
Multipurpose and project vessel time-charter rates have remained elevated ($25,000–35,000/day for mid-size project carriers in the 15,000–25,000 dwt range) due to competing demand from breakbulk projects in Africa, the Middle East, and subsea. However, spot voyages have not spiked proportionately, suggesting that while available tonnage is tight, cargo volumes have not justified additional rate premiums. Lead times for heavy-lift project slots have extended to 12–16 weeks in some cases due to scheduling clashes around major infrastructure projects (renewables, bridge work, and LNG).
Regional Insights – Deep Dive
Ocean freight trends - Europe
Main market trend
Asian export supply is meeting weak European import demand halfway. The region is experiencing a classic post-frontload deflation: shippers who rushed containers into Hamburg, Rotterdam, and Antwerp in May-June are working through inventory, postponing August and September bookings. This is the seasonal turn that typically occurs mid-July, but it has arrived on schedule partly because the April-May surge was so abnormal (started 60 days early).
Main Reasons for Bottlenecks
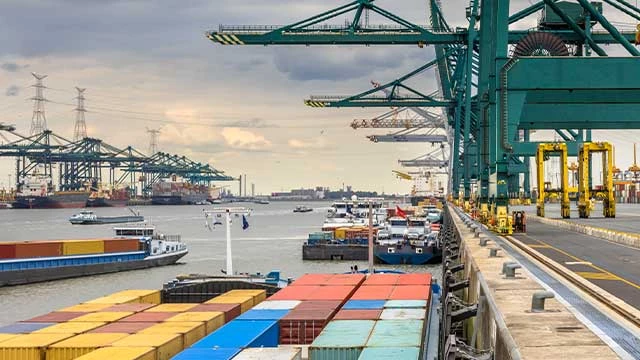
Port infrastructure and EU regulatory cost. At Rotterdam, the 7-day average vessel waiting time is around 1.71 days, with high yard density and ongoing inland barge congestion continuing to impact operations. Periodic restrictions on the acceptance of empty containers remain in place, which may affect equipment availability and cargo flows¹⁹. Antwerp was hit by a toxic gas incident on 14 July that disrupted operations temporarily. The real friction, however, is structural: the EU ETS expansion is adding approximately $150–400 per container to landed costs for European imports, and this is now baked into shippers' calculations. European demand is price-elastic at these levels. Substitution to air (smaller shipments, higher-margin goods) and nearshoring are both accelerating.
Impact on Freight Rates
Asia-Europe rates have compressed 1–2% week-on-week and will likely soften 8–15% through August as the rate environment normalizes post-peak. Shanghai-Rotterdam spot assessments at $5,377/FEU (3 July) represent a return to more rational levels but remain +144% versus February. Mediterranean routes are even softer, with spot-versus-FAK spreads widening, signaling carrier desperation to fill capacity. Northern Europe will be the first to crack; Mediterranean (Genoa, Valencia) will follow 2–3 weeks later as empty repositioning southward increases.
Ocean freight trends - Asia Pacific
Main Market Trend
The Asia shipping market has shifted from relatively stable conditions to a tighter and more volatile environment with the recent events on the Iran conflicts and the US tariffs. Stronger than expected peak season demand and front loading of cargo have supported vessel utilization rate and pushed freight rates higher on the major east-west trade lanes. At this time of writing, the renewed instability around the Middle East, and Strait of Hormuz is again creating additional uncertainty over vessel routing and fuel costs. This means a broader normalization is yet to be seen, and we should expect capacity availability is still to be constrained by longer voyages, port delays, port congestion, and carrier capacity management. The outlook for the coming months is more uncertain than previously expected.

Operational pressure points
- Renewed instability in the Middle East is creating significant uncertainty for vessel operators.
- Longer voyage times are expected to continue.
- Bunker and operating costs volatility will continue on its upward pressure.
- Typhoon related disruption has caused temporary and intermittent stoppages and closures, with knock-on effects on vessel rotations and cargo connections.
Impact on Asian ports
- Major transhipment hubs including Singapore, Shanghai, Ningbo, Zhoushan, Port Klang, and Tanjung Pelepas continue to experience increased vessel bunching and localized congestion due to stronger cargo volumes and longer vessel cycles.
- Vessel bunching will become more frequent, particularly where weather disruptions coincide with high seasonal volumes.
Freight rate outlook
- Asia-Europe freight rates remain elevated and volatile.
- Asia-US Transpacific freight rates remain relatively strong, supported by early peak season demand.
- Asia-Mediterranean freight rates started to soften slightly, however, they remain elevated compared to earlier 2026 levels.
- Intra-Asia freight rates remain relatively firm in selected markets due to feeder constraints, port congestion and the after-effects of disrupted deep sea schedules.
Main reason for bottlenecks
The Strait of Hormuz is now a permanent cost factor, not an acute crisis. Carriers have absorbed the extra fuel burn and delay into their tariffs and are unlikely to unwind diversion costs until political resolution is demonstrable. The new Houthi blockade threat on Saudi Arabia (announced 20 July) does not directly affect container routing through the Red Sea, but it does increase insurance costs and vessel security premiums on eastbound Far East-Middle East trades. Project cargo and breakbulk serving the Gulf region (petrochemical equipment, industrial) will face higher voyage-charter rates and longer lead times.
Impact on Freight Rates
Intra-Asia indices are the weakest in the market. Drewry's Intra-Asia Container Index (IACI) softened 1% to $978 per 40ft container as of 16 July 2026²², down from $993 a week prior and reflecting softer regional feeder traffic. The reason: mainline carriers are absorbing the lower-tier regional volumes at thin margins rather than blanking sailings, defending their utilization. Any further easing in regional GDP growth will trigger immediate carrier blanking on weaker Asian intra-regional lanes.
Ocean freight trends - North America
Main market trend
Early-season absorption of container demand is giving way to hesitation. Importers frontloaded cargo for three reasons in May and June: tariff hedging, Hormuz risk mitigation, and early school and retail seasonality. That impulse is spent. July booking volumes show deceleration, and carriers have begun offering spot-rate concessions on secondary lanes (e.g., Shanghai to Savannah, Shanghai to Long Beach) to fill otherwise rolling sailings.
Main reason for bottlenecks
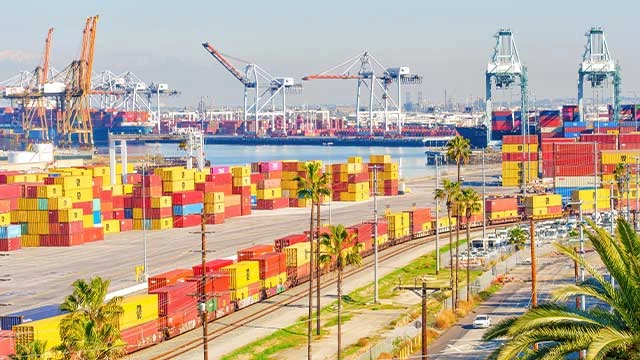
Port congestion at the US East Coast (New York, Newark, Savannah) remains the primary constraint. High terminal congestion continues, driven by shipping schedule changes, trucking delays, berth pressure, rail capacity constraints, and seasonal driver shortages¹⁷. These are not vessel-side constraints but inland logistics failures. Empty container repositioning to inland points (chassis availability, rail lift capacity) is the real pinch. This creates a paradox: vessels arrive on schedule, but containers cannot be cleared, which translates into higher demurrage and extended free-time disputes with carriers.
Impact on Freight Rates
Westbound container availability from the US to Asia remains loose; shipper pricing power on return legs is limited. Eastbound (Asia-US) rates have softened 1–5% week-on-week and will likely ease a further 5–10% by early August as frontloaded demand truly clears. Transatlantic routes (US East Coast to Northern Europe) are softer still, with North Europe to US East Coast rates down 1% week-on-week¹⁸, reflecting subdued intra-Atlantic flow and high vessel supply.
Ocean freight trends - South America
Main market trend
Early-July booking volumes showed strong export demand to North America and Europe, supported by currency strength in the region (lower local cost of imports, higher export margins). However, the frontloading dynamic that drove Asian imports to the US and Europe did not apply here, so South American volume has been steadier and less volatile.
Main reason for bottlenecks
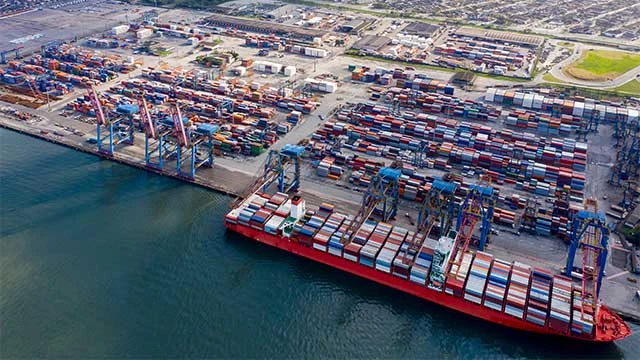
Bunker and fuel costs at Santos and other Brazilian ports have increased the total landed cost of exports. As of 17 July 2026, Santos VLSFO stands at $795 USD/mt²⁵. High bunker costs make Santos expensive as a vessel stop for bunkering (relative to Houston or Rotterdam). This has created a diversion of some vessel fuel consumption to cheaper hubs, adding miles and schedule delays. Additionally, South American export terminals (Santos, Rio, Buenos Aires) lack the scale and automation of North Asian hubs, so vessel turnaround times remain 3–5 days versus 1–2 days in Shanghai or Singapore.
Impact on Freight Rates
South America-to-North America and South America-to-Europe rates have remained remarkably flat compared to trans-Pacific and trans-Atlantic routes. VLSFO pricing shows Santos at $795/mt, versus Singapore at $756/mt and Rotterdam at $669/mt²⁶. This suggests that the South American carrier capacity is less constrained by the Hormuz crisis and that shipper demand, while steady, is not driving rate volatility. Rates are likely to ease modestly (2–5%) by late August as peak season ends and backhaul imbalances normalize. The real structural issue for South American shippers is inland transportation cost and port dwell: getting cargo to a Brazilian port efficiently is often more expensive than the ocean freight itself.
Ocean freight trends - Middle East
Main market trend
The Strait of Hormuz closure has bifurcated the Middle East market. Inbound supply to the Gulf (Saudi Arabia, UAE, Kuwait) is now moving via the indirect corridor: Far East to Suez or around the Cape, then eastward to Jeddah, Khor Fakkan, Salalah, and other gulf bypass ports. This adds 7–10 days to transit and increases port charges. Outbound traffic from the Gulf to global markets faces acute uncertainty: carriers do not know if the route will stabilize, so they are pricing conservatively and avoiding commitment to multi-week contracts.
Main reason for bottlenecks
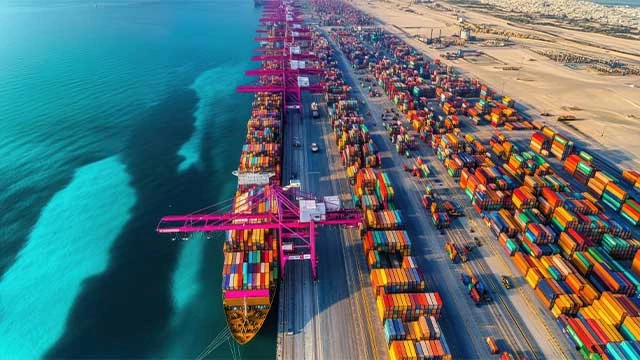
Port infrastructure at bypass hubs is near saturation. Jeddah (Saudi Arabia), Khor Fakkan (UAE), and Salalah (Oman) are receiving disproportionate container volume as Gulf carriers and shippers redirect traffic away from the Strait.
Maersk announced a Far East Asia to Middle East PSS of $1,000 per 40ft from 1 July²³, acknowledging the detour cost and attempting to recover it directly. This surcharge is likely to persist even if the Strait reopens, because carriers will argue that logistical infrastructure investment warrants retention.
The new Houthi blockade threat (20 July) is strategically significant but operationally less disruptive than the Hormuz closure, because container routes have already adapted to avoid the Bab el-Mandeb. Breakbulk and project cargo serving Saudi and UAE are at higher risk: these shipments often move via direct Gulf port calls and cannot easily reroute.
Impact on Freight Rates
Gulf-destined containers are experiencing PSS escalation ($1,000–1,800/teu depending on origin and size) on top of already-elevated spot rates. Westbound (Gulf to Europe, US) rates have spiked similarly. A backhaul from Jeddah to Rotterdam, for example, now costs 40–50% more than pre-Hormuz levels due to capacity imbalance (far more inbound than outbound) and schedule unreliability. This creates an incentive for empty repositioning, which provides short-term relief but masks underlying demand weakness.
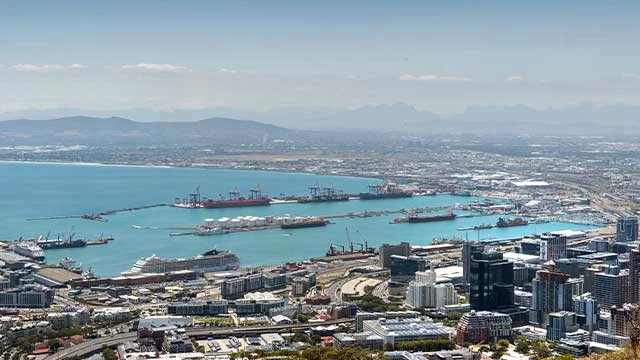
Ocean freight trends - South Africa
Main market trend
The region is a beneficiary of Hormuz disruption diversion traffic but faces structural decline in regional manufacturing. Container volumes through South African ports (Durban, Cape Town) have not spiked materially despite being on reroute paths. This indicates that the diversion is more of a carrier network shift than a true cargo shift. Very few containers are physically originating in or destined for South Africa; most are simply transiting through the region on longer loops from Asia to Europe via the Cape.
Main reason for bottlenecks
Terminal capacity at Durban is constrained; the port is a single-operator quasi-monopoly with limited labor flexibility and aged infrastructure. Although volume through South Africa is moderate, quality of service (berth delays, crane downtime) remains below international standards. This limits Durban's ability to capture transshipment volumes that might otherwise justify infrastructure investment.
Impact on Freight Rates
South Africa-origin and destination rates (e.g., Durban to Europe) have remained relatively stable despite the broader market spike. This suggests that rates on South African-specific lanes are set by local shipper affordability and regional shipper desperation to secure slots, not by global spot-market dynamics. The PSS implemented by Maersk from Far East to Southern Africa ($1,800/teu, 1 July) is higher than mainline rates, reflecting the carrier's view that demand to the region is inelastic and will bear incremental cost.
Operational Insights
Key insight: Vessel waiting times at major hubs are moderate, but inland dwell—the time containers spend at the terminal before pickup or delivery—remains elevated, particularly in Europe (Rotterdam, Hamburg) and the US East Coast. This mismatch creates demurrage exposure and incentivizes early cargo pickup, putting pressure on inland logistics providers. Shippers should budget 4–5 extra free days on European import containers and 2–3 on US East Coast to avoid detention charges.
Bunker Prices and Surcharge Implications
Bunker prices remain elevated and volatile due to geopolitical risk and energy supply constraints. As of 17 July 2026:
Container Freight Market Analysis
Spot Rate Developments
|
Port |
VLSFO (USD/mt) |
MGO (USD/mt) |
HSFO 380 (USD/mt) |
|
Singapore |
756 |
1,325 |
627 |
|
Rotterdam |
669 |
1,332 |
601 |
|
Houston |
686 |
1,301 |
595 |
|
Fujairah |
687 |
1,388 |
573 |
|
Santos |
795 |
1,365 |
510 |
VLSFO spread (Scrubber Spread) and market dynamics: The VLSFO-to-HSFO spread has widened in recent weeks, reflecting high compliance costs and supply-side constraints. Carriers have passed this through via Bunker Adjustment Factors (BAF) and separate ECS/Emergency Cost Surcharges. The additional varies by carrier and lane but typically adds $50–150/TEU on Asia-Europe and $30–80/TEU on trans-Pacific routes. These charges are updated monthly, creating invoice unpredictability. Shippers are increasingly seeking fixed-BAF or fuel-neutral contracts to hedge this exposure.
Energy & emissions implications: EU ETS expansion (now at 100% cost recovery for 2026) is adding an estimated $150–400/container to Asia-Europe landed costs. This structural cost will not reverse and is beginning to shift shippers' sourcing logic (nearshoring, India sourcing vs. China, increased air freight for time-sensitive goods).
Market Outlook & Strategic Recommendations
Spot rates on trans-Pacific and trans-Atlantic lanes soften 5–12% by end of August as frontloaded demand clears and carrier blanking accelerates. Container indices fall to $4,200–4,400 range by early September. Intra-Asia rates remain soft. The Strait of Hormuz stays functionally closed; no meaningful re-routing changes. Houthi blockade threats remain rhetorical but elevate risk premiums on certain trades. Bunker prices stabilize in the $90–100 Brent range. Breakbulk and project cargo rates ease modestly (3–8%) as container softening reduces displacement demand. Full recovery to pre-February price levels unlikely within 2026.
Operational Forecast
Short-term (next 4 weeks, to ~20 August): Spot rates decline 5–8% WoW on primary fronthauls. Carrier blanking increases 20–40% above seasonal norms. Port dwell times in Europe ease slightly as throughput normalizes. Bunker prices remain range-bound ($85–95 Brent). Houthi blockade threats remain unresolved; no material change to East-West routing decisions.
Structural risks through year-end: (1) Hormuz and Red Sea remain unstable; any escalation reruns the rate-spike dynamic. (2) EU ETS costs continue to depress European import demand. (3) US tariff policy uncertainty returns in Q3 as 2024 tariff packages expire. (4) Energy prices remain elevated, supporting continued bunker/ECS surcharge implementation by carriers.
Key Takeaway
The container market has reached a technical inflection point driven by artificial demand frontloading rather than structural growth. Shippers accelerated volumes to hedge tariffs and geopolitical risk; carriers rerouted capacity and implemented emergency surcharges; both actions compressed slot availability and inflated rates to historically elevated levels. The peak has now passed. Rates are softening, carrier sailing blanking is increasing.
Customer advice
Considering the ever-changing market conditions and forces, please:
- Let's closely monitor the developments in the US trade policy and the impending world events to maneuver potential challenges effectively in the logistics industry.
- Think ahead and book well in advance. Try to plan for 6 months ++.
- Consider that the market can change significantly. Further disruptions can happen anytime.
- Identify contract options that enable flexibility and resilience for your business.
However, it is our job at Bertling to keep global supply moving and do all we can and apply our knowledge, network and expertise to protect our clients’ while taking the latest market developments into account. We are there to find the best solutions to ensure cargo flows.
Footnotes & Sources
¹ Xeneta Weekly Ocean Container Shipping Market Update: Rates Softening. Published by Hellenic Shipping News, 16 July 2026.
² Xeneta Weekly Ocean Container Shipping Market Update: Rates Softening. Published by Hellenic Shipping News, 16 July 2026.
³ Xeneta Weekly Ocean Container Shipping Market Update: Rates on the Rise. Published by Hellenic Shipping News, 3 July 2026.
⁴ Drewry World Container Index Assessment. Drewry Shipping Consultants Limited, 16 July 2026.
⁵ Xeneta Senior Shipping Analyst Emily Stausbøll commentary, Xeneta Weekly Ocean Container Shipping Market Update: Rates Softening, 16 July 2026.
⁶ Council on Foreign Relations, "Another Hormuz? What to Know About the Houthi Threat to the Red Sea," 20 July 2026.
⁷ 2026 Strait of Hormuz Crisis. Wikipedia article, accessed July 2026.
⁸ Straits.live. "Strait of Hormuz Closed, Day 144." Live Tracker & Monitor, 22 July 2026.
⁹ Council on Foreign Relations, "Another Hormuz? What to Know About the Houthi Threat to the Red Sea," 20 July 2026.
¹⁰ Go Shipping. Bunker Prices Daily. 17 July 2026. Source: https://www.go-shipping.net/bunker-prices
¹¹ Xeneta Weekly Ocean Container Shipping Market Update: Rates Remained Flat Last Week. Published by Hellenic Shipping News, 10 July 2026.
¹² Maersk Tariff Announcement: Revision of Peak Season Surcharge (PSS) from Far East Asia to North Europe and Mediterranean (E1W/E2W). 16 June 2026. Effective 7 July 2026.
¹³ CMA CGM and MSC tariff updates on Indian Subcontinent to Europe routes, Tradlinx Blogs: "CMA CGM, MSC, Maersk and Hapag-Lloyd Just Moved Indian Subcontinent Pricing." 21 July 2026.
¹⁴ Hapag-Lloyd General Rate Increase (GRI) from Indian Subcontinent and Pakistan to USA and Canada, all coasts. Effective 1 August 2026. Source: Tradlinx Blogs, 21 July 2026.
¹⁵ Drewry Container Capacity Insight. "Blank Sailings Tracker." 17 July 2026.
¹⁶ Heavy Lift & Project Forwarding International. "Breakbulk Volumes Shrink Further at Melbourne Port." 3 July 2026.
¹⁷ Kuehne+Nagel Port Operational Updates. "Port Operational Updates from Around the World (15–21 July 2026)." 21 July 2026.
¹⁸ Xeneta Weekly Ocean Container Shipping Market Update: Rates Softening. Published by Hellenic Shipping News, 16 July 2026.
¹⁹ Kuehne+Nagel Port Operational Updates. "Port Operational Updates from Around the World (15–21 July 2026)." 21 July 2026.
²⁰ The Loadstar. "Rate Rises Loom as Port Congestion Hits Four-Year High." 6 July 2026.
²¹ Kuehne+Nagel Port Operational Updates. "Port Operational Updates from Around the World (15–21 July 2026)." 21 July 2026.
²² Drewry World Container Index. Intra-Asia Container Index (IACI). 16 July 2026.
²³ Maersk Tariff Announcement: Peak Season Surcharge (PSS) from Far East Asia to Middle East and Southern Africa. Effective 1 July 2026.
²⁴ Go Shipping. Bunker Prices Daily. 17 July 2026. VLSFO rates by port.
²⁵ Go Shipping. Bunker Prices Daily. 17 July 2026.
²⁶ Go Shipping. Bunker Prices Daily. 17 July 2026. Comparative VLSFO pricing across major bunkering hubs.
Disclaimer: This report is based on publicly available market intelligence and represents analysis as of 23 July 2026. Forward-looking statements reflect base-case assumptions and are subject to risks outlined in the Market Outlook section. Actual market conditions may vary. For questions or custom analysis, contact Bertling Market Intelligence.


Strait of Hormuz & Suez
Rerouting via the Cape of Good Hope has stabilized as a structural realtity, driving significant transit-day extensions...
Project Logistics Stability
Less volatile than container spot indices, but heavily exposed to vessel operations cost hikes, permit backlogs...
Cost Recovery Mechanisms
Carriers have decoupled margins from pure base rates, executing cost recovery through complex floating surcharges...