


Europe
Asia Pacific
North America
South America
Middle East
South Africa
Executive Summary
The container market has fractured into highly divergent regional dynamics between August 3 and September 1, contradicting expectations of uniform oversupply-driven softening.
South America has become the rate spike epicenter: Shanghai-Santos rates surged 52.5% (USD 6,025 to USD 9,188/FEU) and the West Coast jumped 53.7% (USD 5,121 to USD 7,870), reflecting acute carrier capacity rationing and premium-route prioritization. Europe shows the opposite picture, with Shanghai-Rotterdam declining 7.5% to USD 4,452 and Shanghai-Genova falling 13% to USD 4,910, driven by weak demand and carrier oversupply. The US sits in the middle: rates to Los Angeles firmed 7.2% to USD 7,443, while the East Coast increased 5.9% to USD 10,768, signaling carrier discipline rather than demand recovery. This selective rate movement stems from carrier strategies to protect premiums on high-yield routes through blank sailings (6–8% of East-West capacity) while allowing European rates to compress under overcapacity.
Asian port congestion from consecutive typhoons persists with Shanghai averaging 4–8 days wait. Most critically, Hapag-Lloyd has announced suspension of Arab Gulf port services, causing a major operational disruption requiring immediate shipper action and likely to trigger capacity shortages and rate spikes across Gulf-bound cargo. The market's defining characteristic is now divergence: South America importers and Arab Gulf-bound shippers face acute challenges, while European importers have access to competitive rates and US-bound shippers must maintain flexibility.
Global Economic & Trade Context
The Strait of Hormuz remains effectively closed, with transits at approximately 10% of the historical 85-vessel-per-day baseline. No diplomatic breakthrough has materialized, and both the US and Iran are maintaining hardline positions into September 2026. The Red Sea security situation re-escalated in late August when Houthis claimed attacks on Saudi tankers (the Amzan, Almasi, and others), sustaining the Cape rerouting premium and adding 3,500 nautical miles and 10–14 additional days to East-West voyages.
Manufacturing and retail demand in major Western markets remains tepid, with the US National Retail Federation forecasting October 2026 container imports down 11.5% year-on-year, November down 14.4%, and December down 17.9%. This demand weakness, combined with 3.6% additional fleet capacity in 2026, has locked the industry into structural overcapacity. Carriers are not competing on price; instead, they are rationing capacity and protecting revenue through selective blank sailings and surcharge stacking.
Ocean freight trends - Europe
European container markets are showing clear signs of rate ceiling pricing. Shanghai-Rotterdam rates have declined to USD 4,452 (down 7.5% from USD 4,813 on August 3), while Shanghai-Genova is at USD 4,910 (down 13% from USD 5,641), reflecting shipper push-back against surcharge stacking and weak demand that has become a stronger force than operational congestion. Labor shortages from summer holidays, railway maintenance closures in Germany and Italy, and Rhine River barge scarcity from low-water levels remain the primary bottlenecks, though the growing surplus of vessel capacity is now the dominant rate driver.
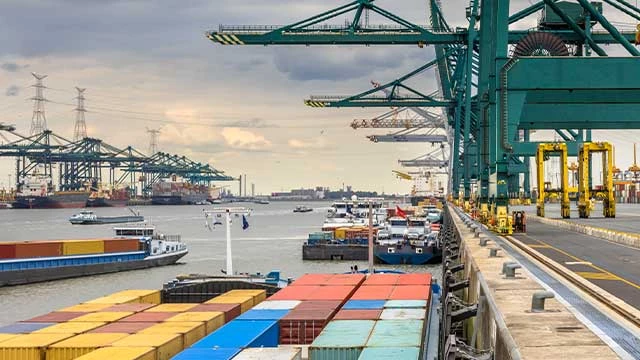
Headlines will soften further into Q4 as oversupply reinforces the downward trend, though all-in costs including surcharges and inland fees may remain elevated until Rhine water levels normalize (typically November-December post-autumn rains). Shippers should lock forward contracts on any uncommitted volume; European rates represent the best value globally at current levels.
Ocean freight trends - Asia Pacific
Asia-Pacific container volumes remain resilient despite severe disruption from consecutive typhoons (Bavi, Noul, Dolphin, Saudel), each causing multi-day port closures and vessel bunching. Port Klang is experiencing vessel waiting times of up to 70 hours, Singapore's yard operates at 95% capacity, and Chittagong reports 6–10 day ship waits. The Drewry Intra-Asia Container Index surged 10% to USD 1,199/FEU on August 27, driven by vessel bunching and premium demand for rapid feeder rotations. Regional demand (intra-Asia, Asia-Middle East) remains fundamentally stronger than long-haul trade, as it is less dependent on volatile Western consumer retail cycles.

Transpacific rates firmed 5.9–7.2% between August 3 and September 1, contrary to expectations of broad oversupply-driven declines. This reflects carrier discipline achieved through selective blank sailings and capacity allocation rather than demand strength. Carriers are directing available slots toward higher-yield routes while blanking others. Europe-bound rates declined sharply (Rotterdam -7.5%, Genova -13%) due to demand weakness, creating a stark contrast with North America-bound cargo. Demand is expected to remain flat through September with no traditional peak season anticipated, though tactical rate swings aligned with carrier slot management will likely continue. Spot rates may soften 8–12% into Q4 if carriers reduce blank sailings but will hold firm if capacity rationing persists.
Operational pressure points
- Congestion/weather: Key risks at Shanghai, Ningbo, Yantian and Hong Kong.
- Capacity: Blank sailings continue across major East-West trades.
- Geopolitics: Increasing uncertainty and costs.
Impact on Asian ports
- Irregular vessel arrivals and periodic vessel bunching are expected.
- Delays at major Chinese ports may affect Southeast Asian hubs.
- Singapore and Port Klang face knock-on berth and transshipment pressure.
Freight rate outlook
- Rates likely remain firm in the near term.
- Asia-Europe rates may soften as demand moderates.
- Rates should remain above pre-disruption levels.
Ocean freight trends - North America
The North American container market is in a post-frontloading lull with import volumes The North American container market is in a post-frontloading lull with import volumes declining after a busy June and July. US West Coast rates have increased to USD 7,443/FEU (up 7.2% from August 3), while East Coast rates moved to USD 10,768/FEU(up5.9%), representing modest carrier-managed firmness rather than demand recovery. Pacific Northwest ports face tightness with Prince Rupert and Vancouver experiencing waiting times up to 7 days, while a nationwide truck driver shortage continues to constrain inland logistics capacity.
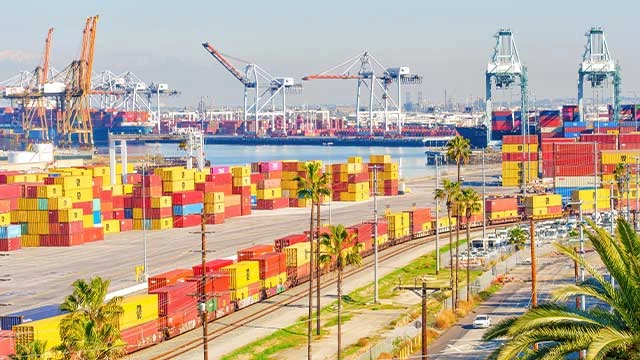
New tariffs effective in August (35% on Canadian goods, de minimis exemption suspension) and the US port entry fees for Chinese-linked vessels possibly beginning October 14, 2026 (USD 50/mt escalating to USD 140 by 2028) add complexity but have not yet driven rate spikes.
Transpacific rates will hold firm if Hormuz closure persists and carriers maintain blank sailings at current levels. The US East Coast is likely to remain at USD 10,500+ through September. If carriers reduce blanks or redirect excess capacity to transpacific routes, rates could soften 8–12% into Q4, but this appears unlikely given their prioritization of premium corridors.
Ocean freight trends - South America
South America has become the most volatile rate epicenter globally between August 3 and September 1. Shanghai-Santos rates surged 52.5% to USD 9,188/FEU, while West Coast rates jumped 53.7% to USD 7,870/FEU. This dramatic reversal reflects severe carrier capacity rationing to the region, with carriers prioritizing South America for premium yields and implementing aggressive blank sailings elsewhere to redirect available capacity.
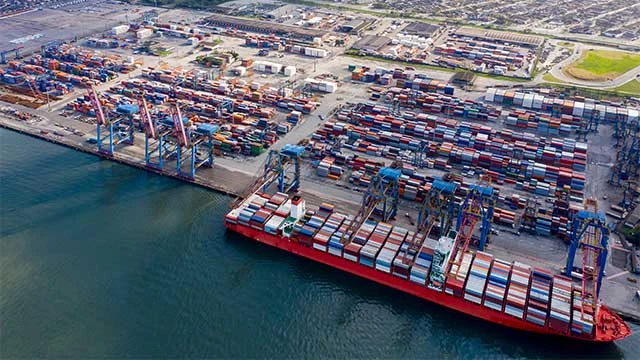
Carrier capacity concentration and Red Sea rerouting extending transit times to South America account for the rate explosion. The sustainability of these premiums depends entirely on carrier discipline; any reduction in blank sailings or competitive capacity additions will trigger sharp corrections. Shippers with South America commitments should urgently evaluate delay options for non-urgent cargo until October-November when rates may moderate. Booking should pause for non-critical shipments unless existing long-term contracts exist at locked rates.
Ocean freight trends - Middle East
Although the Suez Canal remains technically open, renewed security risks in the Red Sea keep most major carriers on Cape routing. Jebel Ali volumes dropped by 60% year-on-year, and Saudi ports posted +12% year-on-year with transshipment up 35% via Jeddah, showing demand resilience through Middle East hubs. The Strait of Hormuz remains navigable but transits stay at 10% of historical norms due to ongoing US-Iran tensions and blockades.
UAE – Fujairah & Khorfakkan: Ports operational but heavily congested. Anchorage delays exceed 3 weeks for breakbulk and 2 weeks for containers. Customs-bonded transfers to Jebel Ali/Abu Dhabi are also delayed, impacting exports and outbound traffic.
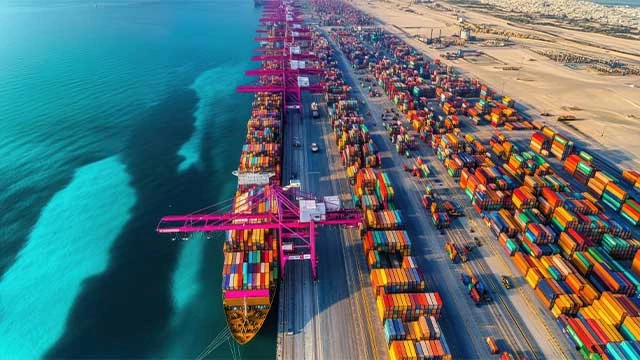
Oman – Sohar, Duqm & Salalah: Breakbulk waiting times exceed 6 weeks. Mixed local/transit cargo vessels may face 8–10 weeks at anchorage due to Oman’s priority on local imports.
KSA – Jeddah: Port operational, but inland congestion remains severe, with 2+ week landside and anchorage delays, high yard density and full reefer capacity. Several carriers have restricted transit cargo to the Gulf, increasing pressure on Fujairah and Khorfakkan.
A critical disruption has emerged: Hapag-Lloyd has announced suspension of Arab Gulf port services, removing an estimated 8–12% of Gulf-bound container capacity and forcing urgent shipper reallocation to MSC, Maersk, CMA CGM, and regional carriers. Shippers with existing Hapag-Lloyd Gulf contracts must immediately secure alternative space; expect rate spikes and elevated surcharges on Gulf-bound cargo as remaining carriers recognize their improved negotiating position. Carriers have already pushed Peak Season Surcharges on Indian Subcontinent and Middle East corridors (Hapag-Lloyd USD 1,500/container to Europe and Mediterranean from July 22; Maersk PSS updates in August).
Bunker and war-risk costs remain elevated (VLSFO Fujairah ~USD 493/mt, Singapore ~USD 498/mt). India's monsoon continues to disrupt terminals at Nhava Sheva and other facilities, while Colombo faces seasonal congestion with 1–2 week feeder delays, and Singapore's backlog ripples into Indian feeder schedules.
Ocean freight trends - South Africa
Shanghai-Durban rates have softened slightly to USD 3,753/FEU (down 2.1% from August 3), reflecting broader African-bound oversupply dynamics. Transnet handled an average of 14,168 TEUs per day with containers up 17% month-on-month and 30% year-on-year; rail cargo out of Durban surged 105% week-on-week. Charter rates are up 11% year-on-year, reflecting continued strength in project and breakbulk segments.
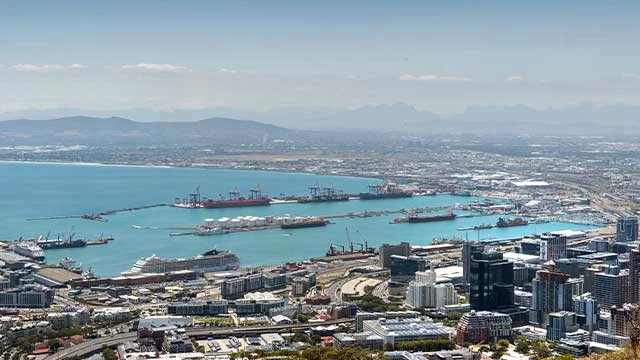
Port performance has improved with new equipment and management strategies, though weather-related disruptions (faulty reefers at Cape Town, high swells at Durban), rail infrastructure cable theft, and border congestion (up to 6.8 hours average at key crossing points) continue to strain operations.
The citrus peak season and rerouted global traffic will stress port capacity through Q4. Shippers must factor buffer times and prepare for continued high all-in costs including surcharges.
Special notice on disruptions at Durban Gateway Terminal:
- Operational disruption remains severe, with no clear recovery yet underway.
- Despite some improvement in yard metrics, overall terminal performance remains constrained by persistent vessel congestion, backlogs, and weak throughput.
- Port congestion is the primary risk to recovery.
- The anchorage queue has increased from 9 to 10 vessels, and the broader vessel pipeline continues to extend delays and limit the terminal's ability to normalise operations.
- Supply chain impacts are forcing industry workarounds.
- Ongoing port instability is driving stakeholders to implement contingency measures, including vessel diversions and alternative logistics arrangements, with potential cost and service implications.
Customer advice
Immediate Actions Required: Shippers with Arab Gulf commitments must urgently notify logistics partners and secure alternative carrier space on MSC, Maersk, or CMA CGM as Hapag-Lloyd's suspension will create acute capacity constraints. South America represents a crisis market with rates at extreme premiums; non-urgent cargo should pause booking or evaluate delays to October-November.
Strategic Positioning: The market is not uniformly softening; carriers execute surgical capacity allocation to protect premiums on selected lanes while allowing European rates to decline. Urgently assess exposure by lane and carrier. Lock multi-voyage charter contracts 90–120 days forward for project and breakbulk operations; these provide budget protection in volatile conditions. Negotiate escalation clauses tied to Drewry WCI or Xeneta indices rather than fixed rates. Maintain daily contact with logistics partners - this market moves too fast for weekly updates.
*Transparency Notice: This article was generated with the assistance of Artificial Intelligence (AI) to provide timely and relevant insights into global logistics. The content has been reviewed for accuracy and completeness by our Bertling Logistics editorial team prior to publication.


Strait of Hormuz & Suez
Rerouting via the Cape of Good Hope has stabilized as a structural realtity, driving significant transit-day extensions...
Project Logistics Stability
Less volatile than container spot indices, but heavily exposed to vessel operations cost hikes, permit backlogs...
Cost Recovery Mechanisms
Carriers have decoupled margins from pure base rates, executing cost recovery through complex floating surcharges...