

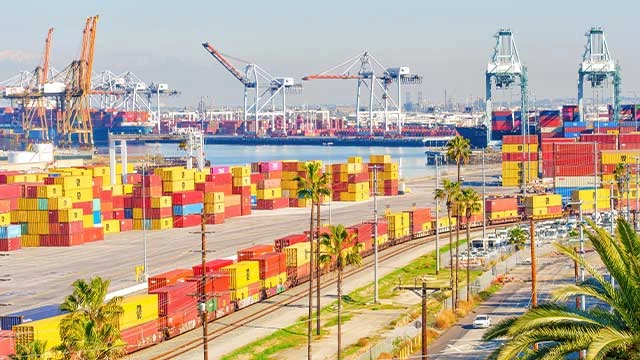
North America
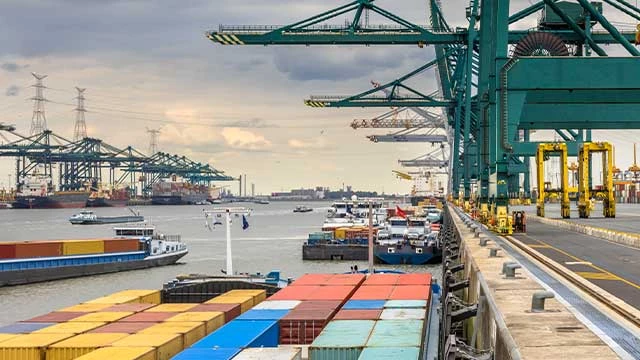
Europe
Asia Pacific
Middle East
South Africa
South America
Executive Summary
Global ocean freight in April 2026 is being shaped less by demand strength than by disruption economics. The dominant market driver is the Middle East shock: the Strait of Hormuz disruption, elevated fuel costs, emergency surcharges, network re-routing, and downstream congestion at diversion hubs. Container spot rates remain elevated versus late February, but the pattern is fragmented: Asia–Europe softened in mid-April, while Transpacific and Transatlantic lanes remained firm or moved higher.
Schedule reliability deteriorated again, falling to 59.0% in February, with average delays for late vessels at 5.49 days. Breakbulk and project cargo remain more stable than liner shipping, supported by tighter specialized tonnage and more disciplined pricing. For forwarders, the next 1–3 months are likely to be defined by volatile surcharges, uneven carrier capacity discipline, soft underlying cargo demand, and persistent execution risk around Europe, the Gulf, India transshipment nodes, and selected Latin American and African gateways.

LET US KNOW YOUR OPINION
How do you like our Market Reports? Fill in our survey (it only takes a minute) to share for feedback and gain even better market insights in the future.
Global Economic & Trade Context
The macro backdrop is softer than freight pricing alone would suggest. The IMF’s April 2026 World Economic Outlook projects global growth at 3.1% in 2026 and 3.2% in 2027 under a limited-conflict assumption, while also warning that the Middle East war is lifting commodity prices, inflation expectations, and financial stress. That means the freight market is not being supported by broad-based end-demand strength; it is being supported by cost inflation and network disruption.
On trade, the WTO’s March 2026 outlook said merchandise trade growth is expected to slow sharply to 1.9% in 2026 from 4.6% in 2025, with downside risk to 1.4% if energy prices remain high. That is a weak demand setting for container shipping and helps explain why carriers still need blank sailings, PSSs and bunker pass-throughs to defend rate levels.
Energy is the key swing factor. The IMF statistical appendix assumes oil averages $82.22/bbl in 2026, but that reference path was already challenged in April by conflict-related oil volatility. Reuters reported Brent around $97.58/bbl on 22 April after a cease-fire extension, still far above the IMF reference assumption and consistent with the emergency bunker measures carriers introduced in March and April.
A practical implication for freight buyers: the market is not tight because global trade is booming. It is tight where networks are impaired, fuel is expensive, insurance is constrained, and cargo is bunching into alternative hubs. That distinction matters, because it argues for continued volatility rather than a sustained, demand-led bull market.
Container Freight Market Analysis
Spot Rate Developments
Xeneta’s 17 April market averages show the current divergence clearly: Far East–US West Coast at USD 2,833/FEU, Far East–US East Coast at USD 3,894/FEU, Far East–North Europe at USD 2,699/FEU, Far East–Mediterranean at USD 3,842/FEU, and North Europe–US East Coast at USD 2,157/FEU.
Versus 28 February, the increases are still substantial: +51% to USWC, +44% to USEC, +26% to North Europe, +21% to the Mediterranean, and +43% on North Europe–USEC.
Drewry’s World Container Index for 16 April fell 3% week on week to $2,246 per 40ft, ending a six-week rally.
Drewry also reported:
Shanghai–New York at $3,552
Shanghai–Los Angeles at $2,810
While noting softer Asia–Europe and Transpacific levels but continued firmness in the Transatlantic.
Freightos confirms the short-term direction rather than the absolute level. In its 14 April update, FBX weekly readings showed Asia–USWC up 3%, Asia–USEC up 10%, Asia–North Europe down 4%, and Asia–Mediterranean flat. One week earlier, on 7 April, Freightos showed Asia–USWC up 11%, Asia–USEC up 5%, Asia–North Europe up 2%, and Asia–Mediterranean down 2%. The message is simple: Europe softened first, while US-bound lanes stayed stronger.
Carrier strategies: capacity, blank sailings, GRIs and alliances
Carrier behavior remains defensive and tactical. Drewry’s cancelled sailings tracker indicated 59 blank sailings out of 685 scheduled departures over weeks 17–21, roughly 9% of planned sailings. On the Transpacific alone, Drewry noted nine blank sailings for the following week even as some carriers announced PSS of about $2,000 per 40ft effective 1 May.
The surcharge layer has become central. Maersk’s temporary Emergency Bunker Surcharge, updated 31 March, applies globally from 25 March: $400 per 40ft on long-haul headhaul dry cargo, $200 on long-haul backhaul, and $200 on intra-trades; reefer levels are higher. Hapag-Lloyd also introduced an Emergency Fuel Surcharge in March, with long-haul front-haul dry cargo at $160/TEU and reefer at $225/TEU, plus additional trade-specific contingency and recovery charges.
Alliance behavior is diverging. Sea-Intelligence said Gemini’s deployed capacity stayed relatively flat while its market share on Asia–North Europe, Asia–NAWC and Asia–NAEC contracted as Ocean Alliance expanded faster post-CNY, with hardly any blank sailings on those services. That points to two different commercial models: one prioritizing network stability, the other elasticity and volume capture.
Carrier network design is also being reshaped by EU ETS. Sea-Intelligence found the newly announced 2026 Asia–Europe networks reduced aggregate ETS-chargeable sailing distance by a further 11% versus 2025, driven mainly by Gemini and Ocean Alliance. In practice, that means routing decisions are now influenced by both operational risk and regulatory cost engineering.
Space availability
Space availability is trade-specific rather than universally tight. Xeneta’s 17 April offered-capacity data showed Far East–North Europe capacity up 8.5% week on week and Far East–USEC up 4.4%, but Far East–USWC down 2.3%, Far East–Med down 2.1% and North Europe–USEC down 9.0%. That combination explains why published index rates can soften in one corridor while premium cargo still faces elevated space costs in another.
Breakbulk & Project Cargo Segment
Breakbulk and project cargo continue to look healthier than the liner market from a pricing-discipline perspective. Bertling’s March market report noted the segment was outperforming container shipping in pricing stability, while Drewry’s breakbulk indices now separately track project and general cargo, reflecting a market that is structurally different from standard liner trades.
The MPP/heavy-lift market is not booming, but it is not breaking either. Public April coverage of Toepfer’s monthly update indicated the multipurpose market moved broadly sideways in April, with project-cargo visibility clouded by Middle East tensions rather than collapsing demand. Bertling cited a March Toepfer level around USD 12,750, while Project Cargo Journal coverage indicated the April level eased only marginally to about USD 12,683.
Operationally, breakbulk remains more stable because capacity is less fungible. Cargo selection, engineering constraints, deck strength, lifting capability, and port suitability create longer lead times but also protect rate integrity. For energy, mining, industrial and infrastructure cargoes, that means less spot volatility than containers, but higher execution sensitivity when Gulf routings, storage or transshipment plans are affected.
Ocean freight trends - North America
Main market trend
- US-bound container rates remain firmer than Europe-bound rates, especially to the East Coast. Xeneta shows Far East–USWC and USEC still far above late-February levels, while Freightos’ April updates show USEC outperforming USWC on recent weekly change.
Main reasons for bottlenecks
- Not berth congestion, but inland and rail fluidity. Market reports import rail dwell of 8 days at Houston, 8 at Long Beach, 5 at Los Angeles, 5 at New York and 10 at Philadelphia.
Impact on Freight Rates
- Rate resilience is stronger on East Coast-linked networks than Pacific loops, but this is still a surcharge- and capacity-managed market rather than a strong-volume market.
Ocean freight trends - Europe
Main market trend
- Europe saw the earliest conflict-led rate spike, but also the first mid-April easing on spot benchmarks. Xeneta and Freightos both show North Europe softening versus the US-bound trades.
Main reasons for bottlenecks
- North Range and Mediterranean port disruption. Maersk flagged high yard density in Rotterdam and weather-related congestion in the Western Mediterranean.
Impact on Freight Rates
- Rates have stopped climbing as fast, but Europe remains operationally fragile and cost-heavy because of fuel, weather, off-window arrivals and port/feeder knock-on effects.
Ocean freight trends - Asia
Main Market Trend
- The Asia shipping market is currently in a fragile and highly reactive state due to a combination of reactions brought by the structural oversupply and external disruptions.
- Demand remains moderate with no strong rebound from the US and Europe. During this time, global vessel capacity continues to expand, keeping underlying pressure on freight rates.
- The ongoing geopolitical risks and operational disruptions are preventing the market from weakening drastically. In short, the soft fundamentals and persistent disruption equate to a volatile, but range bound market.

Main reasons for bottlenecks
- Fuel prices remain elevated and unpredictable due to the Middle East situation. Voyage costs are increased with carriers imposing BAF and Emergency surcharges.
Impact on Asian ports
- Status quo with the continued instability in the Middle East is forcing vessels to avoid high risk zones and reroute via longer paths, i.e. around Africa, is adding at least 10-14 days transit time on major trade lanes. Vessel bunching and irregular arrivals is an effect from such instability. Intermittent congestion at bunkering and transshipment hubs such as Singapore, Shanghai, Ningbo, Zhoushan, and Port Klang.
Impact on Freight Rates
- Freight rates are slightly volatile, depends on trade lane. Asia to Europe is supported by longer routing and cost pressures. Transpacific is softer due to weaker demand and excess capacity. Intra-Asia is mixed with short term fluctuation.
Ocean freight trends - Middle East
Main market trend
- Recent developments indicate a potential for limited, conditional transit through the Strait of Hormuz. However, this should not be interpreted as a normalization of shipping operations. Vessel movements remain minimal, and most carriers continue to adopt a cautious stance. As a result, supply chain disruptions, elevated freight costs, and operational uncertainties persist across the region.
Main reasons for bottlenecks
Transit activity remains heavily restricted, with only a limited number of vessels operating under controlled conditions. A stable and reliable passage regime has not yet been established, and most major carriers have not resumed regular services. As a result, a significant backlog of vessels is currently awaiting clearance.
Capacity & Routing
Capacity across the region remains severely constrained due to limited carrier participation.
To maintain flows, alternative routing solutions are being utilized:
- Exports are primarily routed via Salalah, Sohar, and Jeddah
- Imports are being handled via Khor Fakkan, often combined with multimodal solutions into the UAE and wider GCC region

Congestion & Delays
Congestion continues to build across transshipment hubs and alternative gateways, leading to operational inefficiencies.
Cargo is increasingly experiencing entrapment and extended dwell times in Gulf ports. According to project44, average dwell times as of 20 April have reached:
- Abu Dhabi: 48.9 days
- Jebel Ali: 46.9 days
Land transport corridors remain operational but are under pressure:
- Border congestion is causing delays of 2–3 days
- Truck availability remains limited across the region
Impact on Rates & Trade Flows
The ongoing disruption continues to significantly impact both costs and trade dynamics.
Freight rates, insurance premiums, detention, storage, and alternative routing costs all remain elevated. Carriers are maintaining emergency freight surcharges and bunker adjustments, while some insurers have reduced coverage across the Gulf and Red Sea region.
Freight Rate Development (vs. pre-crisis levels):
- Far East → Middle East: +50–80%
- Europe → Middle East: +40–50%
- Americas → Middle East: +40–50%
- Land transport: +50–60%+
Outlook
While limited vessel movement may increase under controlled conditions, full normalization is not expected in the short term. Most carriers are awaiting sustained stability before resuming regular services.
Ocean freight trends - South Africa
Main market trend
- South Africa remains strategically important as Cape-routing spillover territory rather than as the primary price-setting center. Reuters said Cape diversions add 10–14 days for vessels rerouted to Tanger Med, showing how southern routing continues to reshape network geometry.
Main reasons for bottlenecks
- Weather and selected African-port congestion. E.g. Beira at 12.8 days waiting, Tema at 4.29 days, and Cape Town facing wind-related delays of up to three days at CTCT.
Impact on Freight Rates
- The region benefits from routing relevance but remains vulnerable to spillover delays and export execution issues, especially for perishables and project cargoes tied to Gulf demand.

Ocean freight trends - South America
Main market trend
- South America is less directly exposed than Europe or the Gulf but still affected by global repricing and selective carrier changes. Maersk reports generally stable ECSA and WCSA operations with some stressed nodes.
- The new port of Antioquia, located in the Gulf of Urabá, Colombia, has begun operations. Its strategic location reduces the land distance to Medellín by approximately 350 km compared to other Caribbean ports such as Cartagena or Barranquilla, which can generate significant logistical savings. The port has the capacity to handle approximately 7 million tons of cargo annually, considering up to 650,000 TEUs per year, in addition to bulk grains, general cargo, and vehicles. It has five berths and infrastructure for containers (dry and refrigerated), solid bulk, vehicles, and general cargo, and its 16.5-meter draft allows the operation of large vessels. Major global operators, such as CMA CGM and Maersk, have already begun or announced the transition of their operations to this new port terminal.
Main reasons for bottlenecks
- Paranaguá and Itapoá in ECSA, plus weather on parts of Chile’s coast. Maersk flags Paranaguá and Itapoá as 4–7 day delay pockets and notes severe swells affecting Antofagasta, Arica, Iquique and San Antonio.
Impact on Freight Rates
- Impact on rates and trade flows: Rate upside is milder than on Europe or Gulf-linked corridors, but schedule risk and surcharge pass-through remain real, especially on trades linked to Middle East or transshipment-heavy routings.
Operational Insights
Port congestion is uneven, not universal. Many Gulf ports are still described as operationally open even as cargo dwell in the broader Hormuz network remains extreme. The key issue is no longer just berth waiting; it is dwell, transshipment gridlock and inland clearance.
Bunker remains the largest cost variable. Maersk explicitly tied its emergency bunker surcharge to fuel disruption and stated that 20% of global fuel moves through Hormuz. Bunker availability risk has become a material market factor following the de facto closure of the Strait of Hormuz. While a global physical shortage has not fully materialized, bunker supply in Gulf-linked hubs, especially Fujairah, has tightened sharply, prompting emergency surcharges, fuel redistribution, and increased reliance on alternative bunkering ports such as Singapore and Rotterdam
Market Outlook & Strategic Recommendations
Short-Term Forecast: Next 1–3 Months
Base case for May–July 2026: container rates stay above January/February lows, but the strongest increases are now behind Europe-bound lanes unless the conflict worsens again or PSS will be implemented. Carriers have announced rates increase on different China outbound trades for May. US-bound trades should remain firmer than Asia–Europe, especially on East Coast routings. Reliability will remain fragile, and surcharges will likely remain more important than base-rate momentum. Breakbulk/project cargo should stay comparatively stable, with firm pricing on specialized energy and industrial flows.
Recommendations for shippers
- Carefully check surcharges implemented, not just ocean base rates. EBS/EFS/PSS volatility is now a bigger margin risk than the headline freight index.
- Route by execution quality, not cheapest FAK. Europe and Gulf cargo need buffer-driven routing and realistic inland plans.
- Keep a split procurement model: contract base plus tactical spot access. The market is fragmented enough that one model alone is suboptimal.
- Share internal messaging around dwell and roll risk, especially for Gulf, India-transshipment, Antwerp/Rotterdam and selected ECSA nodes.
- Watch storage, detention and insurance wording closely on any Middle East-linked project flow.
Customer Advice
- Let's closely monitor the developments in the US trade policy and the impending world events to manoeuvre potential challenges effectively in the logistics industry.
- Think ahead and book well in advance. Try to plan for 6 months ++.
- Consider that the market can change significantly. Further disruptions can happen anytime.
- Identify contract options that enable flexibility and resilience for your business.
- Plan 3–4 weeks in advance for all Asia-related cargo.
- Consider alternative European gateways or routings where feasible.
- Maintain flexible delivery schedules to absorb delays.
- Stay engaged for tactical rate and space guidance.
However, it is our job at Bertling to keep global supply moving and do all we can and apply our knowledge, network and expertise to protect our clients’ while taking the latest market developments into account. We are there to find the best solutions to ensure cargo flows.


