

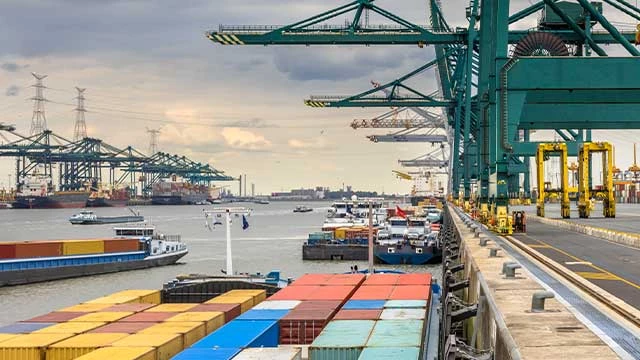
Europe
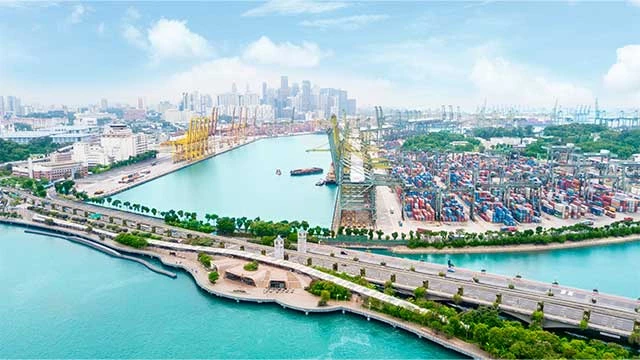
Asia Pacific
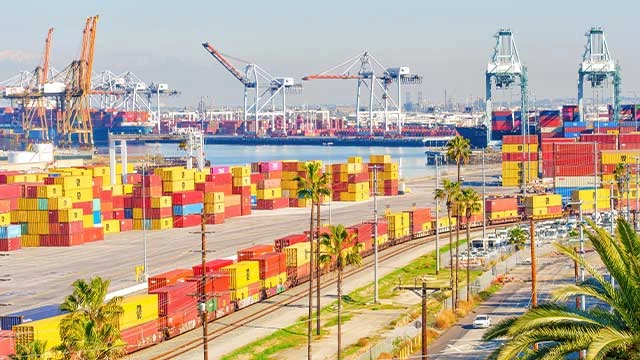
North America
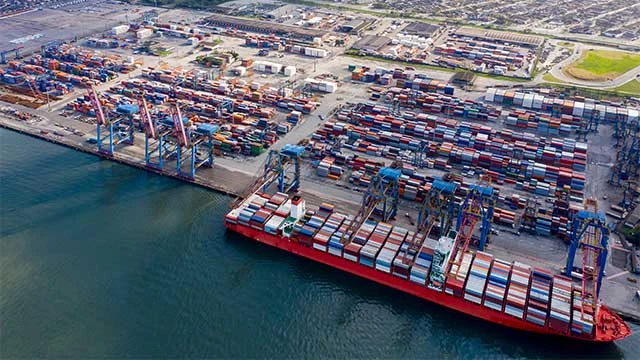
South America
Middle East
South Africa
Summary of the ocean freight market update in April
Economists have warned that Trump’s trade battles will lead to a significant slowdown in global trade and come with a cost for US consumers by pushing up prices and raising the chances of a recession. Washington has imposed a 145% tariff on Chinese imports and a blanket 10% border tax on all other countries, barring some exemptions.
A full-blown trade war between the US and China could divide the global economy into rival blocs and slash worldwide growth by 7% in the long term, the World Trade Organization said. WTO Director-General Ngozi Okonjo-Iweala stated that bilateral trade between the world’s two largest economies could plummet by as much as 80%, with far-reaching consequences.
The U.S. Trade Representative backed off an early proposal that could have levied fees on China-built ships of up to 1.5 million USD per port call, but will start by imposing a 50 USD per net ton fee beginning in mid-October 2025. A notice published by USTR on 17 April Federal Register opened a 30-day public comment period on its proposal for “certain services fees on the maritime transport services of Chinese operators and shipowners” and other measures the Trump administration says are needed to counter “China’s targeting the maritime, logistics, and shipbuilding sectors for dominance.”
Congestion levels are set to rise at ports across Northern Europe—expect schedule disruption, warned Maersk this week. The Danish carrier warned its customers of “increasing congestion levels and operational disruptions,” highlighting Antwerp-Bruges and Bremerhaven as particular choke points. According to maritime intelligence database eeSea, 41% of the vessels at Antwerp are waiting for a berth, with 52 more containerships on their way to the Belgian port. At Bremerhaven, 29% of vessels are waiting, with 27 ships incoming.
The Drewry World Container Index (WCI)—a composite measure of container freight rates—further eased by 1.59% to 2,157 USD per 40-foot equivalent unit (FEU) on 24 April, down from 2,192 USD per FEU the previous week. Uncertainty in global trade due to the ongoing tariff war has dented demand for freight shipping containers. Weaker demand may further dampen sentiment in the freight shipping market.
Energy Price - April 2025
20 March 2025 = 72.00 USD
20 April 2025 = 63.08 USD
- Several OPEC+ members will suggest the group accelerates oil output hikes in June for a second consecutive month, three sources familiar with OPEC+ talks told Reuters, as a dispute worsens between members over compliance with production quotas. Oil prices hit a four-year low in April, dragged down by a U.S.-China trade war and an unexpected decision by OPEC+ to increase output by 411,000 barrels per day of oil in May—which was three times more than the group originally planned. (Reuters)
- Barclays lowered its Brent crude forecast by 4 USD to 70 USD a barrel for 2025 and set its 2026 estimate at 62 USD/b, citing "a rocky road ahead for fundamentals" amid escalating trade tensions and OPEC+'s pivot in its production strategy.
- In 2024, US utilities operated 94 nuclear reactors with a total net generating capacity of nearly 97 gigawatts (GW), the largest commercial nuclear power generation fleet in the world. The next three countries with the largest programs were France with 57 units (63.0 GW), China with 57 units (55.3 GW), and Russia with 36 units (28.6 GW). Nuclear power continues to account for 19% of US power sector electricity generation. (USEIA)
- The US Department of the Interior plans to slice more than 90% off the time it takes to conduct environmental reviews of oil, gas and other energy projects on federal lands, although some policy analysts see limits on the universe of players that could take advantage of the streamlined approach. (Energy Intelligence)
- Global energy demand grew at a faster-than-average pace in 2024 as the consumption of electricity rose around the world – with increased supply of renewables and natural gas covering the majority of additional energy needs, according to a new IEA report. (IEA)
Ocean freight trends - Europe
- Spot rate spike (20%+) early March due to GRIs, followed by steady decline.
- Blank sailings, vessel reassignments (MSC re-routing to Med).
- Long-term contracts increasingly priced with indexation.
- Severe port congestion continues due to storm delays and strikes.
Main Reasons for Bottlenecks
- Red Sea instability: Houthi threats against US-linked vessels have returned. Rerouting via Cape of Good Hope remains active.
- Panama Canal: Low water levels continue to restrict capacity. FMC may take regulatory steps on choke point traffic.
- EU-US trade relations: Tariff escalation temporarily delayed; risk of retaliation (EUR 26B) persists.
- US tariffs: On hold for rest of the world, but China is heavily affected.
- Labour strikes: Rotterdam, French ports, and Brazilian access roads face severe disruptions.
Impact on Freight Rates
- Far East to North Europe: Spot rates decreased by ~28% compared to January 2025. Long-term rates have dropped further, up to USD 2,000/FEU lower than short-term agreements.
- Global average spot rate. Fell another 6.8% in March, currently USD 2,368/40ft.
Outlook
- Rate declines are likely to continue into Q2 due to increasing capacity and uneven demand growth (3–4% projected), but the tariff situation could change situation dramatically, as China might lose part of their biggest market and shift volumes to other markets instead.
- Schedule reliability remains poor (approx. 50–55%), particularly on Asia-Europe and Asia-North America lanes.
Ocean freight trends - Asia Pacific
- As of April 2025, the shifting trade dynamics and geopolitical tensions have shaped the Asia’s shipping industry into a more complexed landscape than before.
- GRIs announced from Asia to Oceania and Middle East.
- Overcapacity risks growing due to ULCVs entering service.
Main Reasons for Bottlenecks
- Schedule reliability remains poor (approx. 50–55%), particularly on Asia-Europe and Asia-North America lanes.
- Port delays in China (Yangtze/Pearl River) due to post-New Year surge and fog.
- Port congestion continues to be a big problem as a result mainly due to the Red Sea Crisis. Main transshipment hubs, e.g. Singapore, are struggling with the increased congestion due to increased cargo volumes coupled with route adjustments and straining port capacities.
- Shifting trade dynamics with the new tariffs, it is expected that shippers will explore re-routing their shipments to hubs such as Singapore, who has a relatively lower tariff from the US. This will create surge in cargo handling volumes, impacting onto the port handling capacities.
- Geopolitical Tensions: Effects from ongoing instability in the Red Sea Region has led carriers to continue avoiding the Suez Canal. The detour around the Cape of Good Hope increases transit times and operational costs, adding onto capacity constraints as the peak season approaches.
Impact on Freight Rates
- Far East to US West Coast: Rates declined by 35% MoM in March. Spot rate now averages USD 2,658/40ft.
- Far East to US East Coast: Down 33%, averaging USD 3,774/40ft.
- Recent Peak Season Surcharges (PSS) increases by Asia-USA carriers have led to a rise in rates on key routes from Asia to USA from April 2025.
- Immediate tariff implementation creates freight rates volatility to fluctuate rapidly. With the early peak season volumes, freight rates are expected to increase in May and June.
- Shippers are front-loading shipments due to the anticipation on both seasonal demands and beating tariffs timelines, resulting in capacity crunch. When these meet higher demand for limited space, freight rates will be pushed upwards on the key trade lanes to Europe and North America.
Outlook
- The shipping industry in Asia is expected to continue facing challenges related to the evolving trade policy shifts, bringing geopolitical tensions. The different voices from shippers and carriers are yet to set in stone on how they will eventually react. The Asia region has strong export performance, and its adaptability signals strong resilience in navigating such complexities. However, shippers should be mindful of the impacts that could fall upon them with the tariff implementations and take necessary countermeasures to go around such impacts.
- With the trade policies, port congestion, overcapacities and geopolitical tensions, we urge all shippers to remain vigilant and adaptable to the dynamic environment and navigate their supply chain needs with caution in Q2 2025 and beyond.
- Bertling and our clients are encouraged to closely monitor the developments in the US trade policy and the impending world events to maneuver potential challenges effectively in the shipping industry.
Ocean freight trends - North America
- The Port of Long Beach, California reported 16 fewer ships to arrive in May, resulting in about 60 ships to arrive compared to the port’s usual monthly total of 80. Approximately half of imports to the Port of LA come from China. “It’s my prediction that in two weeks time, arrivals will drop by 35%, as essentially all shipments out of China for major retailers and manufacturers has ceased, and cargo coming out of Southeast Asia locations is much softer than normal, with the tariffs now in place at this moment, and the news comes out and changes almost hourly,” Gene Seroka, executive director of the Port of LA, said in a Thursday meeting with the LA Board of Harbor Commissioners.
- In published reports, liner operator Hapag-Lloyd said it had seen trans-Pacific bookings drop by 30%, while Evergreen Marine noted trans-Pacific capacity has tumbled by 30%-40% on China export-import volumes that have declined 60%-70%.
Main Reason for Bottlenecks
- Congestion levels across Northern Europe ports could cause delays and impact operations to/from the US
- Schedule reliability remains poor (approx. 50–55%), particularly on Asia-Europe and Asia-North America lanes.
- Export bottlenecks from Southern California due to container imbalance.
- US FMC probing global choke points.
- Weak consumer demand; further pressure expected from reciprocal tariffs.
Impact on Freight Rates
- Rates for shipping containers from southeast Asia and Vietnam have risen above rates from China to the US as tariffs – and a 90-day pause on reciprocal tariffs – are already shifting global trade patterns. Peter Sand, chief analyst at ocean and freight rate analytics firm Xeneta, said he is now seeing the shifting global trade patterns caused by the tariffs play out in ocean freight rates. Sand, using Xeneta data, said importing into the US West Coast from China was more expensive than importing from Vietnam on 16 March. But by 25 April, Vietnam has become the more expensive of the two trades, as shown in the following chart.
- Freight rates from Shanghai, China’s busiest container port complex, to Los Angeles, the largest US import gateway, fell 2% to 2,617 USD per 40-foot container, according to analyst Drewry’s latest World Container Index of spot rates released Thursday. Shanghai to New York decreased 3%, or 95 USD, to 3,611 USD. Rates from Los Angeles to Shanghai remained stable.
Outlook
- In its latest global forecast, Drewry now expects a 1% decline in global container handling this year—comparable to the contraction experienced in 2020 at the height of the pandemic. This would mark only the third annual decline since Drewry began recording such data in 1979, following 2009 (down 8.4%) and 2020 (down 0.9%)
Ocean freight trends - South America
- With the impact of the imposition of tariffs by the US, China may increase its purchase of agricultural products from its South American neighbors. So far, China’s shift away from American products is shaping up to be a major driver of Brazilian and Argentine exports. The Asian superpower ordered a huge number of soybeans from Brazil in April, giving the country an edge in its agricultural rivalry with the U.S., and recently struck a deal to resume purchases of chicken from Argentina.
- Tecon Santos 10: according to the schedule of ANTAQ (National Waterway Transportation Agency), the auction for the concession of the Tecon Santos 10 terminal, with an estimated area of 622,000 square meters, is expected to take place in the last quarter of 2025.
- Port of Santos reported historic TEU throughput but faces post-Carnival backlog.
- The concession will have a term of 25 years, with expected investments of R$5.6 billion, and the objective is to increase cargo movement by up to 3.5 million TEUs per year. In addition, the project includes infrastructure to receive large vessels, over 366 meters in length, compatible with international navigation standards.
Main Reasons for Bottlenecks
- In May 2025, South American shipping is likely to face bottlenecks due to port congestion, evolving regulations, and potential geopolitical instability. While some ports are expanding capacity, increased trade volumes could still lead to delays and higher costs.
- Additionally, climate disruptions, like those affecting the Panama Canal, could impact trade routes and increase transit times.
Impact on Freight Rates
- With effect from 15 May 2025, MSC decided to apply a General Rate Increase (GRI) for all cargo from Brazil, Argentina, Paraguay and Uruguay for the following trades: USA, Canada, Mexico, Central America, Caribbean & WCSA.
- ZIM NEF introduced: EUR 89/TEU (FAK cargo).
- Dry & Reefer cargoes:
- 1000 USD per container 20'DV
- 1000 USD per container 40'DV/HC
- 1000 USD per container 40'HR/RF
Outlook
- The shipping market to South America for May 2025 is expected to be generally stable with steady demand, but with some potential for slowdown and freight rate volatility.
- Demand and port capacity expected to grow steadily.
- Red Sea disruptions continue to affect capacity and congestion remains a concern, potentially leading to delays and extra charges.
Ocean freight trends - Middle East
- Rate erosion continues.
- Space and Equipment availability improved.
- +520 Days after Red Sea Crisis has started and no sight of normalcy with shipping through Red Sea.
- Jebel Ali congestion easing slightly.
Main Reasons for Bottlenecks
- Carriers are implementing blank sailings and adjusting schedules to manage reduced demand and mitigate risks associated with the Red Sea route.
- Dammam experiencing 3-day delays. Cargo meant for Jeddah redirected via Dammam.
Impact on Freight Rates
- Freight rates from China to the Middle East have decreased by approximately 100 USD – 200 USD per 40-foot high-cube container (40HC) in recent months. For instance, rates to Jebel Ali, range between 1,300 USD and 1,650 USD per 40HC.
- Carriers have started restricting booking from Middle east into South East Asia in an attempt to reduce the number of containers flooding into Transhipment ports in that area.
Outlook
- Overall downward rate slide to continue.
- Expect carriers to increase port omissions to consolidate cargo and push rates upwards.
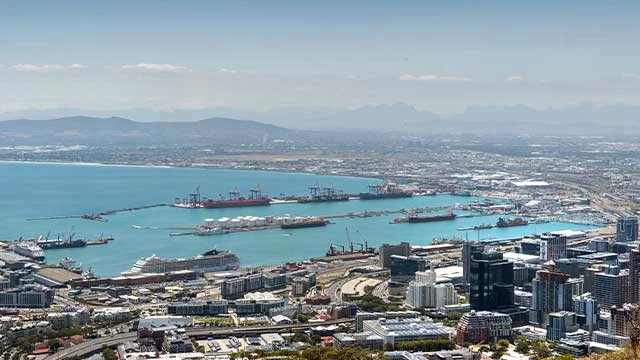
Ocean freight trends - South Africa
- An average of ~9 291 TEUs was handled per day, with ~12 964 TEUs projected for next week.
- Rail cargo handled out of Durban was reported at 2,663 containers, up by ↑9% from last week.
- Truck volumes through Lebombo increased to 1 515 HGVs/day (↑3%), with average crossing times 3,1 hrs.
- Cross-border queue: ↑2,2 hrs; transit: ↑1,7 hrs; SA borders: 13,5 hrs (↑30%); SADC: 5,0 hrs (no change).
- US tariff issued by President Trump affecting ~60% of South Africa (SA)'s exports to US and impacting 1,3% of SA GDP.
- Global spot rates have increased (↑1,8%, or 40 USD) for the first time since January, trading, at 2,208 USD/40’.
Main Reasons for Bottlenecks
- Port operations this week were affected by inclement weather, equipment breakdowns, and vacant berths.
- The Port of Cape Town lost over 30 operational hours to poor weather, while Durban faced persistent equipment failures and similar weather-related delays.
- Eastern Cape ports experienced disruptions primarily due to vacant berths and adverse weather, with Richards Bay also conceding hours to weather.
- The container corridor near Capital Park and Pretoria experienced significant cable theft between Tuesday and Wednesday, causing rail delays.
- On average, four SADC borders took more than a day to cross last week, including Beitbridge Kasumbalesa (the worst affected, with an average of nearly two and a half days from the Zambia side), Katima/Mulilo, and Skilpadshek.
Impact on Freight Rates
- Globally, the world was struck by the United States enacted a sweeping ↑10% universal tariff on all imports—the most comprehensive tariff action since the Great Depression—raising the average effective tariff to approximately ↑20%, with containerised imports seeing rates exceed ↑36%. These measures are expected to significantly disrupt global trade, with heightened risks of inflation, recession, and retaliatory actions, notably from China. Analysts predict a reconfiguration of international supply chains, especially for containerised imports from Asia, which face the steepest increases. This has prompted carriers and shippers to reassess routes and sourcing strategies amid fears of stagflation in the US.
- Despite seasonal expectations post Chinese New Year, freight rates declined amid aggressive pricing and excess capacity—up ↑27% year-on year on Asia–Europe routes.
- Cancellations surged to 198 sailings across East-West routes (↑47%, y/y), possibly signaling weakened demand or strategic capacity management. Yet, global container spot rates saw a modest uptick.
- Charter rates remain robust, with the Harpex index up ↑69% (y/y), driven by tight vessel availability, especially in sub-3,000 TEU segments. Despite geopolitical uncertainty, demand for charters remains resilient, indicating continued strain in shipping logistics.
- Global rates falling while charter rates remain elevated (Harpex Index +72% YoY).
Outlook
- For South Africa, the imposition of 30% tariffs on select exports to the United States marks a significant disruption to a strategic trade relationship.
- It is imperative that South African exporters, importers, and logistics service providers assess their exposure, communicate with clients and partners, and implement proactive risk mitigation strategies.
- Government and industry must work together to accelerate trade diversification, deepen ties with alternative growth markets, and strengthen the enabling environment for affected sectors.
- Ongoing engagement with US counterparts, both diplomatic and commercial, remains crucial to manage uncertainty and influence future outcomes.
- The current challenge underscores the importance of agility, foresight, and partnership across the public and private sectors in navigating an progressively unpredictable global trade environment.
Customer advice
Procurement & Cost Management
- Benchmark rates monthly – market remains volatile.
- Review fuel surcharge clauses – potential for sudden GRI hikes.
Flexibility & Booking Strategy
- Plan shipments 4+ weeks ahead where possible.
- Include clauses in contracts to accommodate rerouting or transshipment delays.
Strategic Use of Bertling Capabilities
- Leverage Bertling’s engineering and project logistics for high-risk corridors.
- Use Bertling's digital IT tools (BLU4U tracking, eco-footprint, reporting) to strengthen operational control.
- Deploy Bertling’s multimodal and heavy-lift capabilities to bypass bottlenecks (e.g., rail-road in Brazil, trucking in South Africa).


