

Europe
Asia Pacific
North America
South America
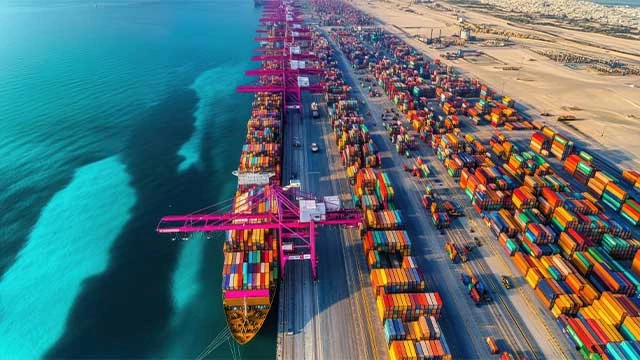
Middle East
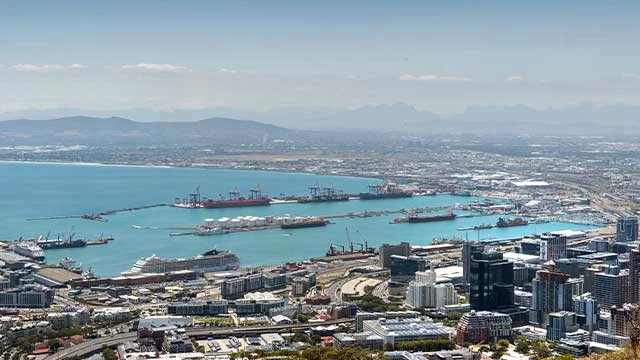
South Africa
Summary of the ocean freight market update in September
The global shipping industry faces a significant financial challenge as United States Trade Representative (USTR) actions to “reverse Chinese dominance and restore American shipbuilding” take effect later this month. According to a new analysis by maritime intelligence firm Alphaliner, leading container shipping companies could face a combined USD 3.2 billion in fees by 2026 if they maintain their current fleet deployment patterns to the United States. Under the USTR Section 301 measures effective 14 October 2025, Chinese-owned or operated vessels will be charged USD 50 per net ton (NT) per voyage to the U.S., rising by USD 30 each year through 2027. In addition, non-Chinese operators using Chinese-built ships over 4,000 TEU or 55,000 DWT face fees starting at USD 18 per NT or USD 120 per TEU in 2025, increasing USD 5 annually. Both fee categories are capped at five voyages per vessel per year and cannot be combined. Meanwhile, operators that order a U.S.-built vessel may receive up to a three-year suspension of these fees. (gCaptain)
Drewry has reported a continued downward trend in global container freight rates, with the Drewry World Container Index (WCI) falling 5% to USD 1,669 per 40ft container for the week of 2 October 2025. This marks the 16th consecutive weekly decline and the lowest level since January 2024. They attribute the ongoing reductions to slowing demand ahead of China's Golden Week holiday, which began on 1 October 2025, and to carriers increasing blank sailings and reducing capacity to match the softer market. Analysts predict that East–West spot rates are likely to continue their decline in the coming weeks. (Drewry)
A slump in ocean shipping demand since U.S. President Donald Trump imposed a raft of new tariffs on trade partners earlier this year has helped send ocean container rates to their lowest since January 2024, threatening profits at major carriers including Maersk and Hapag-Lloyd. The Drewry World Container Index (WCI), which tracks the off-contract "spot" rate to transport a 40-foot cargo container on major shipping lanes, dropped to roughly 20-month low of USD 1,669 per 40-foot container as of Thursday. (Reuters)
The Supreme Court will likely agree with lower courts that ruled President Donald Trump can’t use the International Emergency Economic Powers Act to impose broad tariffs, according to experts surveyed by JPMorgan. Trade and legal experts said the odds that the high court will rule against the Trump administration are 70%-80% and expect a decision by the end of the year, according to the note, which added that the justices may not follow traditional ideological divides. The US’s top court is set to hear cases challenging President Donald Trump’s use of emergency powers to impose tariffs in the first week of November. (Fortune)
Energy Price - September 2025
20 August 2025 = USD 66.84
20 September 2025 = USD 66.68
OPEC+ will raise oil output from November by 137,000 barrels per day (bpd), it said on 5 October 2025, opting for the same fairly modest monthly increase as in October amid persistent worries over a looming supply glut.
The group comprising the Organization of the Petroleum Exporting Countries plus Russia and some smaller producers has increased its oil output targets by more than 2.7 million bpd this year, equating to about 2.5% of global demand. (Reuters)
Growth in distributed solar generation capacity has driven growth in total electricity generation capacity in Brazil since 2019. Distributed solar generation capacity grew from less than 1 gigawatt (GW) in 2018 to 40 GW in 2025 through June, accounting for 43% of all electricity capacity additions over that period. Home and building owners installed more than 3.7 million renewable distributed generation systems in Brazil as of 30 June 2025. (USEIA)
Declines in output from existing oil and gas fields have gathered speed, with implications for markets and energy security. Without continued investment in these fields, the world would lose the equivalent of Brazil and Norway’s combined production from the global oil balance each year. The average rate at which oil and gas fields’ output declines over time has significantly accelerated globally, largely due to higher reliance on shale and deep offshore resources, meaning that companies must work much harder than before just to maintain production at today’s levels, according to a new IEA report. (IEA)
The U.S. Administration wants to ensure that the just-restarted oil exports from Iraq’s semi-autonomous region of Kurdistan continue to flow via pipeline to Turkey in the long run, an anonymous official at the U.S. Department of State told Bloomberg on Friday. The Trump Administration is working toward the goal of keeping Kurdistan’s crude flowing in the long term to boost the Iraqi economy, counter Iran’s influence in the region, and benefit U.S. companies operating in Iraq, according to the official. The U.S. has played a role in the deal that allowed the resumption of the exports from Kurdistan, the official told Bloomberg. (OILPRICE.COM)
The Arab world attracted 360 foreign renewable energy projects between January 2003 and December 2024, with investments surpassing USD 351 billion and generating more than 83,000 jobs, according to a new report from the Arab Investment and Export Credit Guarantee Corp., known as Dhaman. Five countries — Egypt, Morocco, the UAE, Mauritania and Jordan — accounted for 248 projects, or 69 percent of the total, with a combined investment value of USD 291 billion. These projects alone created nearly 68,000 jobs, representing 82% of employment in the sector. – Arab News
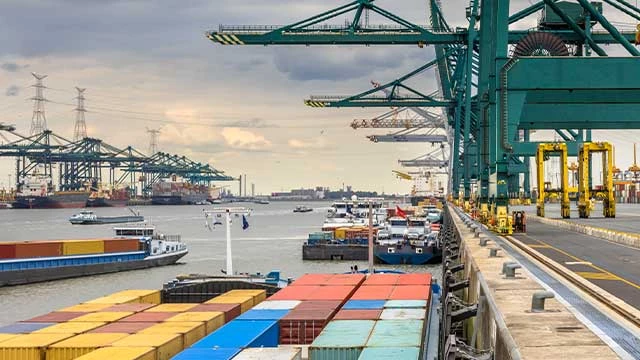
Ocean freight trends - Europe
- In September 2025, the European shipping market saw decreasing multipurpose vessel rates, a slowdown in container rates on Asia-Europe routes, and the implementation of ICS2 Release 3 (the latest phase of the EU's Import Control System 2, which requires businesses to provide more detailed information, including six-digit HS commodity codes and EORI numbers, for goods entering the EU via maritime, road, or rail transport), creating uneven compliance timelines for EU entry summary declarations.
- Key factors influencing the market include ongoing geopolitical uncertainties and a general economic slowdown in key European economies, which suppresses import demand, leading to a largely non-existent peak season.
- The combination of improved market entry through the new trade deal between the US and EU, along with continued strong demand in critical industries such as pharmaceuticals, automotive, and machinery sectors, is anticipated to push export volumes back to the healthy levels seen before the summer period.
- According to Sea Intelligence's most recent reliability analysis, global schedule adherence has dropped to 65.2%, marking the first monthly decrease observed this year. In contrast, the Gemini cooperation maintains its strong performance, consistently exceeding 90% reliability, with their June/July 2025 data indicating 92% on-time arrival rates across all services.
Main Reasons for Bottlenecks
- Port congestion at major hubs like Hamburg and Rotterdam has seen slight improvement due to lower overall volumes. However, the underlying structural issues (labor shortages, inland infrastructure) remain, meaning any surge in vessel arrivals could quickly lead to renewed gridlock.
- Powerful winds are anticipated in northern Europe, while southern regions should prepare for stormy conditions affecting multiple countries.
- All German seaports will move to a secure release order, effectively 1 October 2025 (read more on the Maersk page, for example: https://www.maersk.com/news/articles/2025/07/16/upcoming-change-to-import-container-release-process-at-german-seaports). Customers need to register on time to prevent delays.
- Maintenance at several terminal in Rotterdam and Bremerhaven continue and could cause delays.
Impact on Freight Rates
- Asia-Europe spot rates have stabilized at low levels. Carriers are attempting significant GRIs, but weak European demand will make it difficult to implement them fully.
Outlook
- A weak market with rates likely to remain range-bound, punctuated by volatility from carrier capacity management.
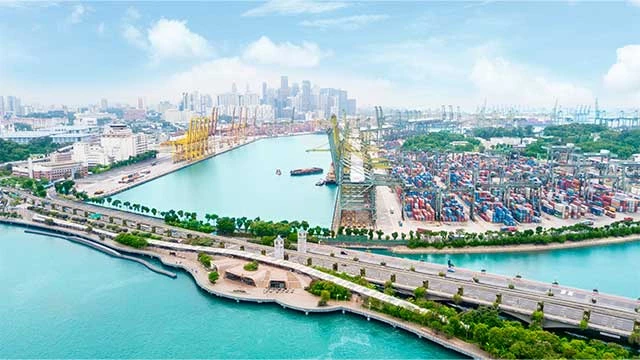
Ocean freight trends - Asia Pacific
- Nearing to Q4 2025, we should expect further rate softening on weaker lanes (especially Asia to the US) unless there is another wave of sudden supply shock or demand spike. Asia to Europe may see some form of stabilization, especially if the Red Sea risks escalate or carriers’ blank sailings tighten capacity. This may be a result of capacity counterbalances the oversupply problem and keeping vessel utilization rate high to prevent rates from freefalling.
- Operational reliability will still remain a key differentiator. We do expect carriers to aim to be nimble with capacity cuts and blank sailings in curbing schedule reliability, optimizing route planning around the risk zones and to ensure adequate equipment availability. Asia is into the seasonal weather with typhoon seasons being a risk affecting shipping and delaying cargo by adding to port congestion snowballing to intermittent hiccups in some Asia major ports.
Main Reasons for Bottlenecks
- Typhoons and Severe Weathers: Multiple typhoons have impacted East Asia in early September. These storms lead to port closures, terminal shutdowns, delayed vessel movements and backlog of cargo. Other ports in China are also experiencing heavy congestion with many vessels waiting at the anchorage for berths.
- Port Congestion: Terminal yards density is high and slow down container movements. Golden week in China in October is also expected to see factories shutdown, earlier cut-off, and condensed cargo flows before the holidays causing short term surges in demand to get the goods out and creating bottlenecks at ports.
Impact on Freight Rates
- Rerouting via the Cape of Good Hope continues, and now congestion at Chinese load ports is extending vessel turnaround times. Impact on rates are stable compared with August. Bottlenecks prevent rates from sliding, even though underlying demand is soft. Carriers have implemented GRIs and peak season surcharges as leverage around Golden Week (see our guidance) cargo rush.
- US Import demand remains lower due to tariffs on Chinese goods. With carriers’ blank sailings and weather delays tightened space, freight rates are holding steady as delays are cushioning rates and not pushing them up strongly.
Outlook
- On the overall, the shipping industry in Asia is entering a phase of stabilization rather than escalation. In September, bottlenecks caused by bad weather, port congestion, and pre-Golden Week cargo surges are keeping freight rates from falling further, even as underlying demand remains subdued.
- Downward pressure from vessel oversupply and weak Western consumer demand will cap freight rates increase. Shippers should expect continued volatility rather than a clear trend, with short-term spikes around disruptions and holidays, but an overarching environment of moderating rates into late 2025 unless surprises such as geopolitical tensions escalate.
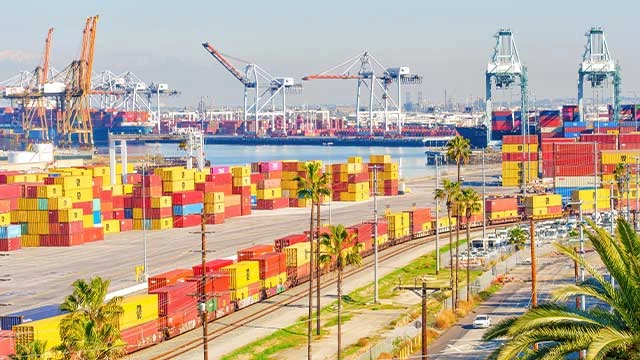
Ocean freight trends - North America
- With few exceptions, the US tariff increases presented on “Liberation Day” are now implemented in full. In addition, several commodity specific tariff increases have increased. Due to weaker US import volumes, volumes to North America have seen negative year-on-year growth since April. We expect that market conditions could be weaker rest-of-year and forecast that North America import volumes will be contract 2% in 2025 while returning to growth in 2026. (BIMCO)
- The Port of Los Angeles has announced its search for proposals from parties interested in the pre-development of Pier 500, a project designed to boost cargo efficiency and accommodate larger, next-generation cargo ships. This development comes after decades of efforts to increase capacity amid rising demand at one of the United States' busiest ports. The proposed site for Pier 500 spans 200 acres and will feature two berths and approximately 3,000 linear feet of new wharf.
Impact on Freight Rates
- Spot rates from Shanghai to key US ports continue to decline, with Shanghai–Los Angeles dropping 5% to USD 2,196 per 40ft container, and Shanghai–New York down 2% to USD 3,200 per 40ft container. (Drewry)
- Freight pricing has been falling since July, with the exception of a small bump in US rates in early September that quickly faded. The latest slide has brought rates to the where they were before the initial spike driven by the Red Sea crisis in late December 2023. The situation is looking particularly dire in the Asia-US west coast lane, where spot rates are below break-even. The SCFI assessed Shanghai-US west coast rates at just USD 1,460 per feu for the week ending Friday, down 11% week on week. This index has not been this low since July 7, 2023. The SCFI Shanghai-US east coast index fell 7% to USD 2,385 per feu, the lowest reading since November 24, 2023. (Lloyds List)
Outlook
- The U.S. container shipping industry is heading toward what could be one of the most significant volume declines in its six-decade history, according to the latest analysis from shipping expert John McCown. Adding another layer of complexity is the upcoming USTR ship fee plan targeting ships built in China or operated by Chinese carriers, set to take effect in mid-October. McCown describes this as “moving container volume related to trade lanes involving the U.S. into unchartered waters.” As these lanes account for more than a quarter of global container miles, “there will be a ripple effect that will be felt globally.” (gCaptain)
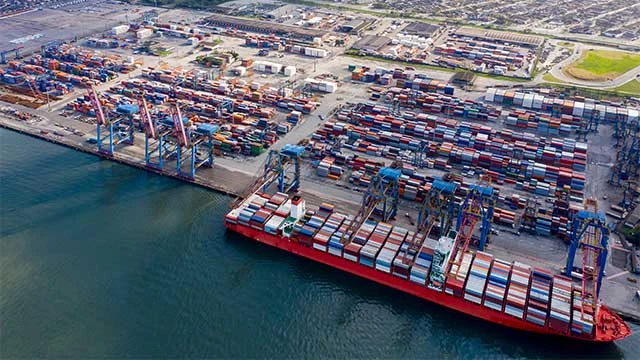
Ocean freight trends - South America
- In Brazil the DP World terminal marked the groundbreaking of its quay expansion works on the left bank of the Port of Santos in Brazil. Scheduled for completion in August 2026, the project will add 190 meters to the existing quay, extending its length to 1,290 meters and enabling the terminal to accommodate larger container vessels.
- The expansion also includes the acquisition of new equipment for container operations. With these investments, the terminal’s handling capacity will increase to 1.7 million TEUs per year by 2026, establishing DP World Santos as one of the most modern private multipurpose terminals in Brazil.
- Chile adopts an action plan to improve port infrastructure and increase cargo capacity at three major ports in northern Chile. The project involves three major ports in the north of the country: Antofagasta, Angamos, and Iquique. In Antofagasta, the largest city in the region with over 500,000 inhabitants, the investment plan reaches USD 100 million to build a logistics center and expand annual throughput capacity to 7 million tons.
Main Reasons for Bottlenecks
- In October 2025, the main shipping bottlenecks in South America stem from limited port infrastructure and low investment, unable to meet rising demand.
- Seasonal agricultural exports (such as coffee and grains) strain terminals and inland logistics, driving up costs and delays.
- Additionally, customs bureaucracy, port congestion, and climate impacts (e.g. Panama Canal restrictions and extreme weather) worsen cargo flow disruptions.
Impact on Freight Rates
- MSC has decided to postpone the application of LWS (Low Water Surcharge) for the imports to Manaus, following the monitoring of Amazon River, the last available data shows that water level is decreasing at a slower pace than initially projected.
- Update on effective date and applicability per origin/trade:
- Americas: as from 15 October 2025.
- Europe (NWC and MED): from 15 October 2025.
- Far East and Relay (IPAK, Middle East, Africa, Black Sea, Greece and Oceania): as from 15 October 2025.
- Effective date will follow each trade/origin’s Price Calculation Date (PCD) policy.
- Amount remains unchanged: USD 1,000/TEU
Outlook
- The outlook for the global shipping market in October 2025 is characterized by weakening demand, especially in container shipping, and rising costs amid geopolitical instability and US tariff impacts.
Ocean freight trends - Middle East
- Red Sea risk re-intensifies → July sinkings and fresh strikes in late August kept most mainline carriers routing via the Cape of Good Hope
- Regional volumes resilient → Jebel Ali H1 volumes +6.7%, shows demand holding up through ME hubs (incl. Jebel Ali). Saudi ports posted +12% YoY boxes in July with transshipment +35% via Jeddah
- Network adjustments → MSC/MAWANI added a “North India–Middle East” weekly link, strengthening India–GCC/Middle East connectivity.
- Transshipment congestion persists → Colombo delays have flared during the monsoon.
- Global spot rates easing from early-year highs
- Although the Suez Canal remains technically open, the renewed security risks in the Red Sea following deadly attacks in July mean most major carriers continue to divert their vessels around Africa. Operations in most ports like Jebel Ali and Ashdod are stable, and the Strait of Hormuz remains navigable. The region's freight and logistics market is poised for strong growth, projected to be valued at USD 173.27 billion in 2025.
Main Reasons for Bottlenecks
- 50% U.S. tariffs on steel/aluminum-linked machinery and components could tighten spreads and dampen orders into U.S. channels
- Security chokepoints:
- Red Sea/Bab el-Mandeb: renewed attacks and counter strikes raise deviation and insurance costs.
- Gulf of Hormuz: elevated rhetoric has lifted marine war-risk pricing across the Gulf.
- The renewed Houthi attacks have made a return to Red Sea transits unlikely for the rest of 2025. Increased security measures at ports in the Eastern Mediterranean, such as Ashdod and Haifa, are causing vessel schedule delays.
- Weather/operations:
- India’s monsoon intermittently halted terminals at Nhava Sheva in Aug Mundra’s empty depots saw flooding-related disruption in July.
- Sri Lanka (Colombo): seasonal congestion; some feeders and transshipment legs face 1–2-week delays.
- Hub congestion spillovers: Singapore backlog (yard ~95%) continues to ripple into Indian feeder schedules.
- Equipment balance: Indian shippers continue to flag low empty availability , risking missed sailings for exports.
Impact on Freight Rates
- Index tone: ME/India legs remain buffered by detours, port congestion, and surcharges.
- Surcharges: Carriers pushed PSS on ISC/ME corridors (e.g., Hapag-Lloyd USD 1,000/ctnr to North America; Maersk PSS updates in Aug). Expect these on quotes from India/ME origins.
- Fuel & insurance costs: VLSFO indicative spot hovered near Fujairah ~USD 493/mt and Singapore ~USD 498/mt ; war-risk premiums up materially after July incidents
- Lane specifics:
- India/ME → Europe: still elevated vs. pre-crisis due to Cape routing and transshipment queues; less downside than trans-Pac.
- India/ME → North America: softening broader trend offset by PSS and longer routings; net effect = stable to slightly down Month on Month into late Aug.
- Intra-ME/ISC & ISC→GCC: improved service options (new MSC loop) help capacity, but ad-hoc delays from weather and hubs keep spot quotes choppy.
- The market is showing signs of firming on specific trade lanes. Carriers have announced GRIs for shipments originating from the Middle East and Gulf region destined for Oceania. For example, ANL introduced a GRI of USD 400 per TEU, effective July 23, signaling confidence in their ability to raise prices on this corridor. Maersk is also introducing an Operational Cost Imports (OCI) surcharge for all containers from the world to Jebel Ali, UAE, effective August 15, 2025.
Outlook
- Rates: Mildly firm on India/ME–Europe (capacity withdrawals + detours), softer on India/ME–North America as trans-Pac weakness leaks into network tempered by PSS and war-risk costs.
- Volumes: Expect pre-festive restocking (ahead of two major festivals in India Dussehra & Diwali in Oct) to support India export flows, particularly electronics, textiles, and FMCG.
- Operations: Monsoon impacts should gradually ease into late Sept, improving schedule integrity at west-coast India; need to watch Singapore/Colombo for lingering queues.
- Risk watch: Any escalation around Yemen/Red Sea or Hormuz can rapidly reprice war-risk and transit plans; assume sustained Suez avoidance by most mainlines into Q4 unless risk subsides materially.
- The market remains on high alert. While day-to-day operations are currently stable in most areas, the security situation is fluid and can change with little notice. Shippers should maintain close and frequent communication with their logistics partners to stay informed of the latest operational advisories and should anticipate continued volatility in both scheduling and pricing.
Ocean freight trends - South Africa
- South African container terminals handled an average of 13,426 TEUs daily, down from 14,727 TEUs the previous week. Operations were hampered by adverse weather, equipment failures, and infrastructure challenges across major ports.
- Challenges include increased volatility and costs due to Red Sea disruptions, which are forcing longer routes around southern Africa, and US tariffs affecting South African trade.
- However, positive developments include growth into Sub-Saharan Africa and new inland port projects like South Africa's Port of Gauteng, aimed at enhancing logistical efficiency. Port of Gauteng will become a major inland port designed to address logistics inefficiencies and support economic growth.
Main Reasons for Bottlenecks
- Cape Town faced weather and equipment constraints
- Durban experienced power failures, equipment breakdowns, and dredging disruptions
- Eastern Cape ports saw weather-related delays
- Richards Bay reported minimal delays
- Continued geopolitical tensions and Red Sea disruptions force longer shipping routes, increasing operating costs and reducing effective capacity.
- N4 Corridor: Stable truck volumes at 1,522 heavy goods vehicles daily, with queue and processing times both decreasing to 4.2 hours (down 10% and 9% respectively). Rail traffic to Maputo decreased to nine trains daily.
- Border Crossings: SADC border crossing times increased substantially. South African borders averaged 12.1 hours (up 17%), while broader SADC region averaged 6.4 hours (up 12%). Four borders—Beitbridge, Groblersbrug, Kasumbalesa, and Zobue/Mwanza—experienced delays approaching 24 hours, with Kasumbalesa taking approximately two days from the Zambian side.
Impact on Freight Rates
- In August 2025, the US implemented a 30% tariff on South African goods, creating negative growth in trade with North America and increasing import costs
- Spot freight rates fell for a ninth straight week, although the charter market continues to defy the downturn with resilient demand across several key corridors
- Container markets remain volatile: the US is experiencing ‘trade whiplash’ from tariff-driven front-loading earlier in the year, while congestion and blank sailings remain stable
- With over 1 million TEU of deliveries still due in 2025, the supply imbalance is unlikely to ease soon
- While global spot rates have fallen for nine consecutive weeks, freight rates on the Asia–South Africa trade lane are moving in the opposite direction due to high demand and constrained capacity. Carriers have implemented substantial Peak Season Surcharges (PSS) of up to USD 1,000 per 40ft container.
Outlook
- Despite challenges, the report notes encouraging signs of efficiency improvements in vessel productivity and truck turnaround times, suggesting incremental progress when coordination and systems align effectively.
Customer advice
Considering the ever-changing market conditions and forces, please:
- Let's closely monitor the developments in the US trade policy and the impending world events to maneuver potential challenges effectively in the logistics industry.
- Think ahead and book well in advance. Try to plan for 6 months ++.
- Consider that the market can change significantly. Further disruptions can happen anytime.
- Identify contract options that enable flexibility and resilience for your business.
- Plan 3–4 weeks in advance for all Asia-related cargo.
- Consider alternative European gateways or routings where feasible.
- Maintain flexible delivery schedules to absorb delays.
- Stay engaged for tactical rate and space guidance.
However, it is our job at Bertling to keep global supply moving and do all we can and apply our knowledge, network and expertise to protect our clients’ while taking the latest market developments into account. We are there to find the best solutions to ensure cargo flows.


