

Europe
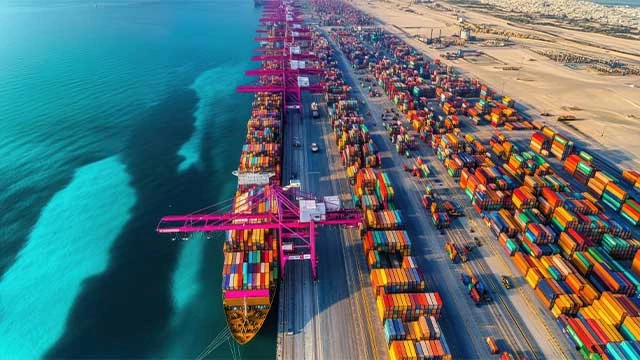
Asia Pacific
North America
South America
Middle East
South Africa
Summary of the ocean freight market update in July
Fitch Ratings has changed its 2025 outlook for the global shipping sector to 'deteriorating' from 'neutral' due to expectations of weaker demand, particularly in container shipping and dry bulk. Tanker shipping is likely to be more stable, benefitting from continued higher-than-average profitability supported by tonne-mile demand dynamics and the potential for oil inventory restocking due to lower oil prices. Container shipping profits are set to decline significantly in 2025 from 2024 levels, which previously benefitted from Red Sea disruptions that increased freight rates. Container volumes in 2025 could be flat or slightly decline compared with last year due to the impact of US tariffs (we expected about 3% growth in early 2025). At the same time, global fleet capacity is likely to increase by about 6%, meaning that even if trade tensions ease and demand subsequently increases, supply will still exceed demand. (Fitch)
In the first six months of 2025, the total throughput of Port of Antwerp-Bruges was 137.2 million tonnes, a decrease of 4.3% compared to the same period last year. Congestion at terminals, driven by a mix of logistical challenges and market developments, remains a persistent issue across Northwest Europe. Key contributors to the congestion include irregular containership arrivals, a legacy of the COVID-19 disruptions, and rerouting around the Cape of Good Hope to avoid the Red Sea. Additionally, the reshuffling of container alliances has led to simultaneous vessel calls and high cargo volumes. Average dwell times have increased from 5 to 7-8 days, putting pressure on personnel and equipment, with union actions adding to the strain. (Port Technology)
With no sign of a peak season that would have traditionally pushed spot rates up in Q3, there is further bad news for carriers on trades from Far East to North Europe and Mediterranean. Carriers will have expected this downturn, but it will not make it any easier to manage given the significant overcapacity in the global fleet. Average spot rates from Far East to Mediterranean will continue their descent in August while rates into North Europe hold a little a little stronger. This means the spread in spot rates on these trades will close in on parity in August, which is a dramatic shift since it stood at USD 1720 in mid-July. (Xeneta)
Drewry’s Container Forecaster expects the supply-demand balance to weaken again in 2025, which will cause spot rates to contract. The volatility and timing of rate changes will depend on Trump’s future tariffs and on capacity changes related to the introduction of US penalties on Chinese ships, which are uncertain. (Drewry)
Energy Price - July 2025
20 June 2025 = USD 74.93
20 July 2025 = USD 68.38
OPEC+ could boost output by as much as 548,000 barrels per day in September - similar to what it did in August, three sources familiar with OPEC+ talks said. A fourth source said discussions on the volume were ongoing and the hike could be smaller. OPEC+ began output increases in April with a hike of 138,000 bpd followed by hikes of 411,000 bpd in May, June and July. (Reuters)
After slowdown this year as market tightness pushed up prices, looser balances appear on the horizon, although significant uncertainties remain. Following a slowdown in 2025, growth in global demand for natural gas is expected to rise in 2026, according to the IEA’s latest quarterly Gas Market Report. (IEA)
The United States exported more crude oil to Nigeria than it received from Nigeria for the first time in February and March 2025. During this period, refinery maintenance on the U.S. East Coast drove down U.S. demand for crude oil imports, including imports from Nigeria, and the relatively new Dangote refinery in Nigeria drove up Nigeria’s demand for inputs, including crude oil it imported from the United States. This marks the first time that the United States was a net crude oil exporter to Nigeria. (USEIA)
The European wind industry is making major strides in its commitment to reuse, recover, or recycle 100% of decommissioned blades and scaling up sustainable end-of-life solutions. The industry demonstrates its leadership through innovation, collaboration, and policy engagement. But challenges remain, especially around unclear waste classifications, the lack of harmonised EU regulations, and limited cost competitiveness of recycling technologies. (Global Energy World)
The combined gas demand in the Middle East and Africa region is expected to rise by 2% in 2025 before accelerating to 3.5 percent in 2026, driven by higher use in the industry and power sector, an analysis showed. In its latest report, the International Energy Agency projected that global gas consumption is projected to reach an all-time high in 2026, with demand growth accelerating to around 2%, up from the expected 1.3% expansion in 2025. (Arab News)
The latest edition of the OECD Nuclear Energy Agency's Small Modular Reactor Dashboard reports growing interest around the world with 51 SMR designs involved in pre-licensing or licensing processes and 85 active discussions between SMR developers and site owners. (World Nuclear News)
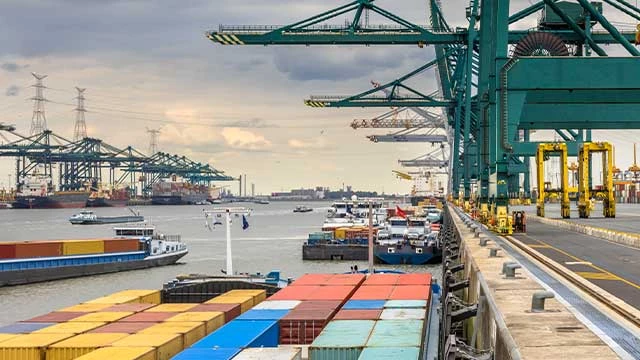
Ocean freight trends - Europe
- Volume in and out of Europe remains strong and capacity is adjusted accordingly.
- Increasing congestion in Northern European Ports remains an ongoing concern.
- The implementation of hub-and-spoke network models by new carrier alliances is also beginning to alter traditional port call rotations, which could concentrate volume at certain hubs while bypassing others.
- Low inland water levels challenge operations
Main Reasons for Bottlenecks
- Major Northern European hubs, including Rotterdam, Antwerp, Hamburg, and Bremerhaven, are experiencing their most significant operational disruptions since the pandemic.
- Average berth waiting times at major North European ports have increased by between 37% and 77% in recent weeks. This situation is compounded by several factors, including labor shortages and strikes, and is critically exacerbated by historically low water levels on the Rhine River. The low water levels are severely restricting inland barge capacity, forcing cargo onto already strained road and rail networks and creating a massive inland bottleneck. At the RWG terminal in Rotterdam, for example, barge delays are reported to be between 72 and 96 hours.
- The challenge is particularly acute for oversized project cargo, which requires specialized handling and transport. The low water levels on the Rhine River are a major impediment to moving heavy components from the major ports to inland project sites, creating significant logistical hurdles.
Impact on Freight Rates
- Worsening congestion may increase rates.
- Freight rates from Asia to Europe have remained firm and are increasing. The supply chain friction is effectively tightening available capacity. Rates from Shanghai to Rotterdam, for instance, rose by 12% in early July. With vessels fully booked through July and into early August, carriers currently hold significant pricing power on this trade lane.
Outlook
- Volatility is expected to persist as trade tensions and political uncertainties dampen business outlook.
- The congestion crisis is expected to persist throughout the summer peak season. Shippers must anticipate continued significant delays, the potential for last-minute port omissions by carriers, and firm rate levels. While utilizing smaller, alternative ports such as Felixstowe in the UK or Trieste in Italy may offer some relief, these secondary ports are also at risk of becoming overwhelmed as more cargo is diverted to them.
Ocean freight trends - Asia Pacific
- The Asian shipping markets continue to face significant pressure and uncertainty, largely driven by fluctuating tariff policies.
- Ongoing tariff volatility has created a fragmented demand environment, where growth expectations are frequently disrupted by pauses in shipment flows. This stop-start pattern has contributed to rising freight rates, along with equipment shortages and space limitations.
- Additionally, global geopolitical tensions including the Iran-Israel conflict, the Red Sea crisis, and the ongoing Russia-Ukraine war are further exacerbating cost pressures across the freight sector.
Main Reasons for Bottlenecks
- Port Congestion: Main ports such as Shanghai, Port Klang, Manila, Laem Chabang, and Tanjung Priok are reporting backlogs (about 1 – 3 days). Singapore is experiencing an average delay of 4 – 6 days at anchorage. Ningbo-Zhoushan Port is facing longer delays with average waiting times of around 9 – 10 days, up from an average of 6 – 7 days in the previous months. Other East Asian ports remain relatively fluid with some slight disruptions. The delays will reduce the vessel turnaround time and may tighten capacity causing short term rate increases.
- Capacity Adjustments: New vessels’ deliveries are exceeding demand. Spot rates will fluctuate with capacity shifts and rerouting costs.
Impact on Freight Rates
- Rerouting vessels via the Cape of Good Hope (COGH) is increasingly becoming the norm, particularly as tensions escalate in the Iran-Israel conflict. This shift is expected to drive up bunker fuel costs, increase insurance premiums, and further strain available vessel capacity. As a result, freight rates on the Asia–Europe trade lane are likely to rise.
- To manage capacity and support rate levels, shipping lines are expected to implement more blank sailings, while General Rate Increases (GRIs) are already being applied to weaker trade routes such as Asia–Australia and Asia–South Asia.
- Meanwhile, Intra-Asia freight rates have remained relatively stable for now.
Outlook
- Similar to June, July continues to see prolonged port congestion across several major ports, leading to extended schedule delays, equipment shortages, and sustained high spot rates.
- The increase in blank sailings is further tightening capacity, with General Rate Increases (GRIs) contributing to rising freight costs.
- At the same time, shifting trade policies are causing fluctuations in cargo volumes, prompting carriers to explore new regional routing options.
- Due to ongoing disruptions in the Red Sea and escalating tensions in the Strait of Hormuz, longer transit times, bypass surcharges, and higher insurance premiums are anticipated.
- Shippers are strongly advised to book shipments early, especially on Asia–Europe routes, and to stay updated on evolving U.S. trade policies, developments in the Middle East, and other global events to better navigate potential disruptions in the shipping landscape.
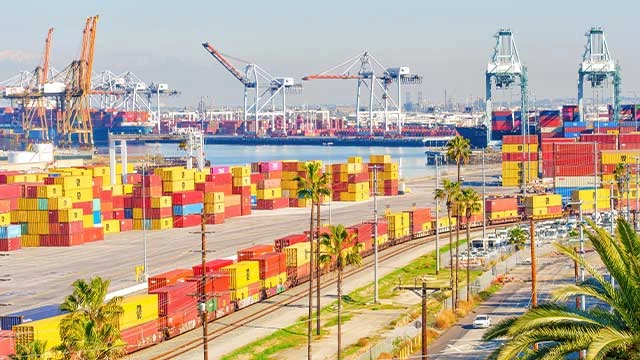
Ocean freight trends - North America
- Executives from the largest US container and energy ports that had been set to receive close to USD 330 million this year for maintaining key infrastructure are warning Congress not to accept the Trump administration’s plan to cancel the money. In a letter sent Thursday to lawmakers responsible for appropriating the Harbor Maintenance Trust Fund (HMTF), the American Association of Port Authorities (AAPA) and 22 port directors asked that they restore requirements agreed to by Congress in 2020 – but which the administration has stripped from its FY25 and FY26 budgets – that allow “donor” ports, which typically include large container ports, along with ports that specialize in energy cargo, to receive a more equitable share of the trust fund as well as to be able to use it for projects other than harbor maintenance. (Freightwaves)
- The U.S. plans to lift its pause on country-specific tariffs while implementing a range of new rates for specific trading partners on 7 August, per an executive order President Donald Trump signed Thursday. The order lists rates for over 60 trading partners, ranging from 10% to 41%.
- The list includes levies for countries that match the rates included in a series of trade-related agreements Trump has announced over the last several months. The order also implements a 25% tariff on imports from India that Trump threatened earlier this week. Tariffs on imports from Canada, Mexico and China will continue to incur separate duties, while goods from countries not listed in the order will face a baseline 10% levy.
Main Reasons for Bottlenecks
- Shipping lines cancel Pacific sailings as US tariff pause ends.
- US container volumes may drop 25%, potentially reducing annual commerce significantly.
Impact on Freight Rates
- Transpacific spot rates fell this week, as rates on Shanghai–Los Angeles were down 2% (USD 2,632/feu) and those on Shanghai–New York also slid 2% (USD 4,135/feu). With a temporary halt on higher US tariffs for Chinese products ending in mid-August, shipping lines are cutting back on services across the Pacific by cancelling more sailings. Since the big rush to ship cargo before the tariff increase is now over, Drewry expects spot rates to remain less volatile in the coming week. (Drewry)
- Latest data from Xeneta shows average spot rates from China to the US West Coast are down 59% since 1 June at USD 2,268 per FEU (40ft container). Rates have also plummeted into the US East Coast, down 43% to USD 3,796 per FEU in the same period. Average spot rates from North Europe to US East Coast are USD 2000 per FEU, down a gentler 5% since 1 June, but a more considerable 25% compared to 1 January. Emily Stausbøll, Xeneta Senior Shipping Analyst, said: “US trade deals are not a magic bullet and we should not expect them to breathe new life into the subdued ocean shipping market." A 15% tariff on imports from the EU is not good news for shippers – it is just news that isn’t as bad as it could have been. (Xeneta)
Outlook
- Veteran industry analyst John McCown, writing in a monthly report based on the 10 largest US ports, said that inbound container volume fell 7.9% in June from a year before. Similar declines during the global financial crisis and the pandemic were short-term slumps. In this case, however, he estimated that a 25% reduction in US container volumes is “readily possible” and would translate “directly into a USD 510 billion reduction in annual commerce for the US.” (Bloomberg)
Ocean freight trends - South America
U.S. President Donald Trump signed an executive order on 30 July 2025, making official the 40% tariff on Brazilian products (a list of exceptions is available in Annex I). This percentage will be added to the 10% already applied since 5 April 2025, totaling a 50% tariff on imports of Brazilian products. The additional 40% measure takes effect seven days after the executive order is signed, that is, on 6 August.
“Articles of Brazil imported into the customs territory of the United States shall be, consistent with law, subject to an additional ad valorem rate of duty of 40%.
This rate of duty shall be effective with respect to goods entered for consumption, or withdrawn from warehouse for consumption, on or after 12:01 AM eastern daylight time 7 days after the date of this order, except those goods encompassed by 50 U.S.C. 1702(b) or set forth in Annex I to this order, and except for goods that (1) were loaded onto a vessel at the port of loading and in transit on the final mode of transit prior to entry into the United States, before 12:01 AM eastern daylight time 7 days after the date of this order; and (2) are entered for consumption, or withdrawn from warehouse for consumption before 12:01 a.m. eastern daylight time on 5 October 2025. The Harmonized Tariff Schedule of the United States shall be modified as provided in Annex II to this order.
The ad valorem duty imposed in this order is in addition to any other duties, fees, taxes, exactions, and charges applicable to such imports, unless subject to existing or future actions under section 232 of the Trade Expansion Act of 1962, in which case the ad valorem duty imposed in this order shall not apply.
The ad valorem duty imposed in this order shall not apply to articles that are excepted by 50 U.S.C. 1702(b) or set forth in Annex I to this order, including certain silicon metal, pig iron, civil aircraft and parts and components thereof, metallurgical grade alumina, tin ore, wood pulp, precious metals, energy and energy products, and fertilizers.”
The complete executive order, as well as the list of exceptions (Annex I), is available at the following link click here.
Main Reasons for Bottlenecks
- In August 2025, the Latin American shipping industry is likely to face bottlenecks due to a combination of factors including surging global demand, port congestion, infrastructure limitations, and potential disruptions from weather events and tariff changes.
Impact on Freight Rates
- MSC and Hapag will adopt a Low Water Surcharge LWS (exceptional and temporary charge due to draft conditions of the Amazon River.) for all shipments to and from Manaus (applicable to all types of containers) LWS: USD 1,000/TEU effective from Hapag 21 August and MSC from 28 August 2025.
- MSC Brazil informed that will apply as from 11 August 2025 an export equipment control fee, the ECF for new bookings, under the below scope:
- ECF - Equipment Control Fee: Value - BRL 200 per unit.
- Scope: Management services for the release of empty containers at depots spread throughout the country. - Hapag Lloyd will apply a General Rate Increase (GRI) of USD 1,000 per container on services from Far East to West Coast of South America, effective 1 August 2025 until further notice.
Outlook
- The total of 50% tariff imposed by the United States on Brazilian exports, as announced by President Donald Trump, could have a significant impact on Brazil's maritime export volumes. While some products may be exempt or have reduced tariffs, sectors such as coffee, beef, fruit, textiles, footwear, and furniture may experience declines in exports in the coming days at least until the market readjusts with new destinations for these products or new negotiations with the American government.
Ocean freight trends - Middle East
- The region's logistics landscape is heavily influenced by geopolitical uncertainty. Although the Suez Canal remains technically open, the persistent security risks in the Red Sea mean most major carriers continue to divert their vessels around Africa.
- However, there are tentative signs of stabilization, with some carriers like Maersk cautiously resuming vessel calls to the Port of Haifa in Israel.
Main Reasons for Bottlenecks
- Geopolitical risk is the foremost bottleneck. The potential for a full or partial closure of the Strait of Hormuz, while considered unlikely, remains a high-impact threat that would severely disrupt access to major hubs like Jebel Ali in Dubai.
- Even without a full closure, heightened security measures at ports in the Eastern Mediterranean, such as Ashdod and Haifa, are already causing vessel schedule delays.
- New customs compliance regulations in Saudi Arabia, such as the mandatory use of pallets for most containerized goods, could create initial challenges for certain types of cargo, although exemptions exist for oversized and heavy machinery shipments.
- The immense demand for specialized transport to service the numerous giga-projects is keeping rates for heavy-lift vessels and specialized MPVs very firm. Competition for these limited assets is high, giving carriers significant pricing leverage.
Impact on Freight Rates
- The market is showing signs of firming on specific trade lanes. Carriers have announced GRIs for shipments originating from the Middle East and Gulf region destined for Oceania. For example, ANL introduced a GRI of USD 400 per TEU, effective 23 July, signaling confidence in their ability to raise prices on this corridor.
Outlook
- The market remains on high alert. While day-to-day operations are currently stable in most areas, the security situation is fluid and can change with little notice.
- Shippers should maintain close and frequent communication with their logistics partners to stay informed of the latest operational advisories and should anticipate continued volatility in both scheduling and pricing.
- The project pipeline in the Middle East is exceptionally strong, suggesting that high demand for break bulk and project cargo services will be sustained for the foreseeable future. The primary risk factor for the sector is not a lack of demand but the potential for regional instability to disrupt complex and time-sensitive project schedules.
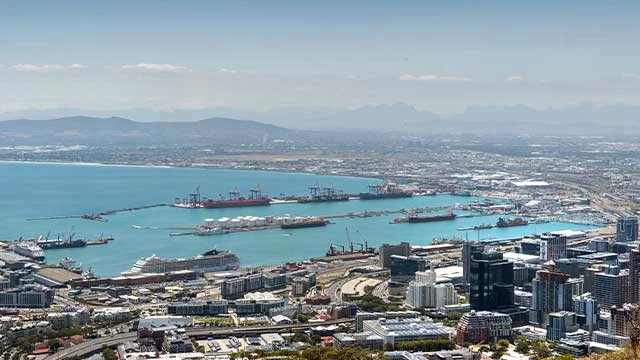
Ocean freight trends - South Africa
- An average of ~14,161 TEUs was handled per day, with ~12,581 TEUs projected for next week.
- Rail cargo handled out of Durban was reported at 2,520 containers, up by ↑29% from last week.
- Cross-border queue: ↑0.3 hrs; transit: ↑0.3 hrs; SA borders: 11.4 hrs (↑20%); SADC: 4.8 hrs (↑4%).
- Global container trade rose by ↑1.4% (m/m) & ↑5.4% (y/y); but forecasts are dim with tensions abound.
- Global spot rates declined for a 6th consecutive week (↓3.3%, or USD 85) to USD 2,517/40ft; charter rates ↑1%.
Main Reasons for Bottlenecks
- Despite another high throughput week, port operations were still intermittently delayed by adverse weather, vacant berths, and continuous equipment breakdowns and shortages.
- Inclement weather and equipment breakdowns proved to be the main operational constraints at the Port of Cape Town, while the main operational challenges in Durban proved to be continuous equipment breakdowns and adverse weather.
- Vacant berths, agent delays, and poor weather mainly impacted operations at our Eastern Cape Ports, while adverse weather and marine equipment challenges hindered operations at the Port of Richards Bay.
- The latest reports from TFR suggest that the annual shutdown on the Pretoria–Durban line continued and concluded; ConCor line was recommissioned after the Dassenhoek derailment, but a hook-up shortly after delayed operations by 4 more hours.
- Crossing times increased significantly at South African borders (~11.4 hrs, ↑20%), with smaller increases across SADC (~4.8 hrs, ↑4%). Beitbridge and Kasumbalesa each took over a day to cross. Other issues: BURS System downtime, capacity planning at Groblersbrug, fines at Nyamapanda, and weighbridge discrepancies at Kazungula and Livingstone.
Impact on Freight Rates
- Global container throughput rose significantly in May, though second-half forecasts are less optimistic amid softening US demand.
- The orderbook remains robust with over 2.6 million TEU added this year.
- Freight rates declined further, prompting carriers to consider selective surcharges to stem losses.
- Port congestion rose slightly, now affecting 8.1% of the fleet.
Outlook
- Geopolitical shifts dominated trade headlines, with the US-China tariff détente extended and a US-EU tariff rollback easing transatlantic tensions.
- While maritime operators are restructuring networks in anticipation of a more stable environment, the persistence of warehousing congestion and regulatory uncertainty continues to cloud logistics planning.
- South African exporters await clarity on proposed US tariffs, risking disruption to automotive, agricultural, and mineral trade flows.
- Despite encouraging developments in our container industry persisting, South Africa’s trade prospects remain overshadowed by ongoing uncertainty around US tariff decisions.
- The looming threat of a 30% export duty – particularly on key sectors such as automotive and agriculture – underscores the fragility of recent gains. Domestically, the logistics sector continues to evolve, marked by rail restructuring and legal reforms, including the ongoing deliberations on the Merchant Shipping Bill. While these changes are aimed at systemic improvement, they also contribute to an increasingly complex landscape. Positives persist, but they are often offset by volatility, delaying the emergence of sustained industry confidence.
Customer advice
Considering the ever-changing market conditions and forces, please:
- Let's closely monitor the developments in the US trade policy and the impending world events to maneuver potential challenges effectively in the logistics industry.
- Think ahead and book well in advance. Try to plan for 6 months ++.
- Consider that the market can change significantly. Further disruptions can happen anytime.
- Identify contract options that enable flexibility and resilience for your business.
- Plan 3–4 weeks in advance for all Asia-related cargo.
- Consider alternative European gateways or routings where feasible.
- Maintain flexible delivery schedules to absorb delays.
- Stay engaged for tactical rate and space guidance.
However, it is our job at Bertling to keep global supply moving and do all we can and apply our knowledge, network and expertise to protect our clients’ while taking the latest market developments into account. We are there to find the best solutions to ensure cargo flows.


