

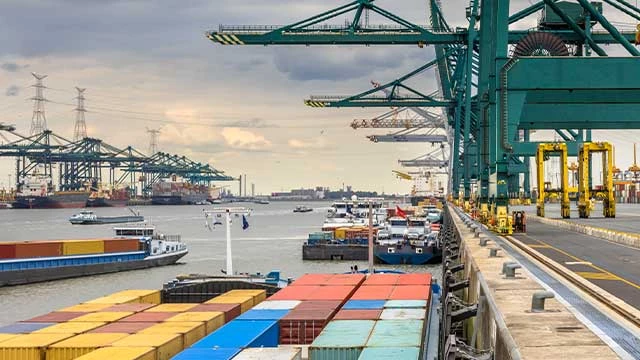
Europe
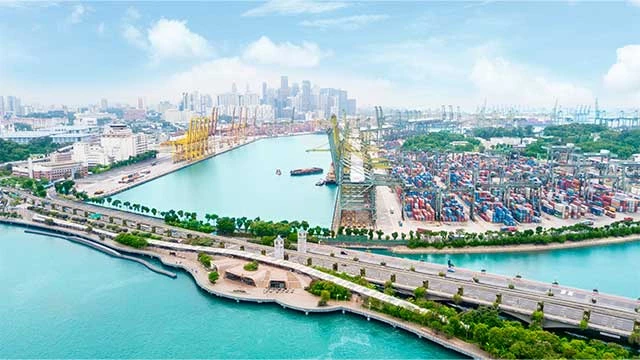
Asia Pacific
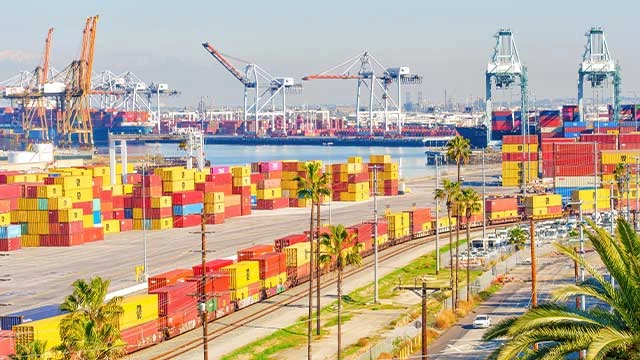
North America
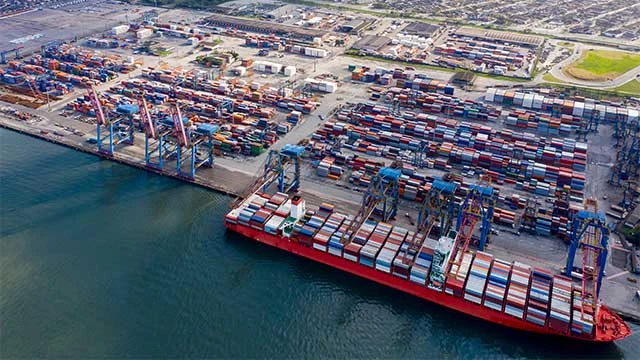
South America
Middle East
South Africa
Summary of the ocean freight market update in December 2025 & January 2026
The market's pivotal issue is the potential large-scale return to the Suez Canal. While most services remain diverted around Africa, some carriers are beginning to test the waters. CMA CGM has structurally restored Suez transits on its INDAMEX service, cutting the round-trip time by two weeks. Maersk also confirmed its first successful trial transit in mid-December. A full return could release an estimated 6.5% of the global fleet currently absorbed by longer voyages (Sea-Intelligence), but this is not expected imminently. In the interim, carriers are actively managing supply, with Maersk announcing a schedule of blank sailings for the post-Chinese New Year period on both Transpacific and Asia-Europe trades.

LET US KNOW YOUR OPINION
How do you like our Market Reports? Fill in our survey (it only takes a minute) to share for feedback and gain even better market insights in the future.
In 2026, BIMCO expects a balance between supply and demand growth. Supply is forecast to grow 3.0% and we expect demand growth of 2.5-3.5%. Supply growth is estimated to marginally outpace demand growth in 2027. Supply growth is forecast at 3.5% while BIMCO expects demand to grow 2.5-3.5%. BIMCO expects that the supply/demand balance in 2027 will be marginally weaker than in 2025 but that it will remain near the 2025 level in 2026. (BIMCO)
Fitch Ratings has maintained its deteriorating outlook for the global shipping sector, reflecting geopolitical and policy risks. The sector will also be affected by the lower GDP growth we expect across most major economies in 2026 compared to 2025. (Fitch)
Energy Price - December 2025 & January 2026
20 January 2026 = USD66.00
20 December 2025 = USD60.55
Energy Developments & Trends
Ocean freight trends - Europe
- Growth forecasts: UNCTAD and OECD project slower global growth in 2026 due to geopolitical tensions and trade tariffs.
- Shipping market trend (2026): Generally bearish because of structural overcapacity (excess new vessels).
- Tighter capacity driven by the pre–Chinese New Year rush and new European regulatory costs.
- European regulations: EU ETS requires shipping lines to cover 100% of emissions in 2026 (up from 70% in 2025).
- Cost impact: Maersk expects higher Emissions Surcharges in Q1 2026 due to ETS and FuelEU Maritime, though overall cost impact may be limited by weak market conditions.
Main reasons for bottlenecks
- Severe port congestion and operational breakdowns are causing extreme vessel delays, particularly at UK ports.
- Strong weather impact in different countries in Europe, connected to the severe snow in many European countries, which will affect terminals and hinterland connections for a longer period of time both on import and export operations
- Equipment shortages in certain ports by individual carriers, especially when vessels are delayed or re-routed.
Impact on Freight Rates
- Spot rates on major East-West trades experienced a surge in December, driven by a combination of pre-Chinese New Year demand and tight, disruption-constrained capacity.
- Carriers have announced a widespread series of significant Peak Season Surcharges (PSS) and General Rate Increases (GRIs) for January 2026. Maersk announced a PSS of USD 800 per 40' container from the Far East to North Europe, while Hapag-Lloyd is implementing a GRI of USD 2,000 per container from the Indian Subcontinent & Middle East to the USA.
- But as it looks at the moment, the volumes out of Asia are not strong enough and rates will remain stable or even decrease in January latest February
Outlook
- Rates are expected to remain elevated through January, fuelled by pre-CNY cargo rush and ongoing capacity constraints. The market faces significant uncertainty heading into Q2 2026.
- A large-scale, coordinated return to the Suez Canal would release a flood of capacity and likely cause rates to fall sharply. However, as noted by BIMCO, this remains a major variable. Without a Suez return, the market balance will remain tighter but in general we may see a softening market.
Ocean freight trends - Asia Pacific
- Persistent geopolitical disruptions, uneven demand recovery, and ongoing structural overcapacity defined the year.
- US tariffs led to inconsistent demand across Asia. Resilient segments: Electronics, e-commerce, and select project cargo performed relatively better. Weak segments: Traditional consumer goods and industrial cargo volumes stayed subdued.
- Volume boost: Q3–Q4 cargo flows were largely driven by front-loading ahead of tariffs, policy uncertainty, and seasonal holidays - not sustained end-market consumption.
Main Reasons for Bottlenecks
- Red Sea and Middle East Security Risks remain unresolved, forcing many Asia-Europe services to continue routing via the COGH with extended transit times, increased fuel and insurance costs, and tied up vessel capacity.
- Port Congestion still persists intermittently at major Asian hubs such as Shanghai, Ningbo, Singapore, Port Klang, and key South Asian gateways, particularly during pre-holiday surges.
- Container equipment imbalances persist in parts of South China and Southeast Asia.
- Notably year end factory and production shutdowns and the build-up towards Lunar New Year 2026 have compressed shipping windows and intensified short term congestion.
Impact on Freight Rates
- Bottlenecks and carrier discipline have helped prevent sharp rate collapse, but weak demand and abundance of global capacity continue to cap upward potential.
- Freight rate environment in Asia remains fragile and highly sensitive to operational disruptions
- Transpacific trend: Demand and spot rates declined from mid-2025.
- Late-year support: Electronics, e-commerce, and holiday replenishment supported firmer demand in November–December, helping stabilize freight rates.
- Policy impact: Extension of the US-China tariff truce reduced the risk of sharp spot rate spikes seen earlier in 2025.
Outlook
- Moving into 2026, the market is expected to remain volatile. Downward pressure from vessel fleet oversupply and cautious global demand will persist. Upward support will continue to come from geopolitical risks, longer vessel routes, seasonal congestion, and carrier capacity management.
- Short term rates spikes may occur around the Lunar New Year period, weather disruptions, or sudden geopolitical escalations. The shipping industry is entering into another phase of “new normal” where it means tighter margins for carriers, greater emphasis on operational reliability, cost control and flexible capacity deployment.
Ocean freight trends - North America
- December 2025 U.S. container imports: 2,227,316 TEUs, up 2% month over month
- Drivers: Early-year frontloading faded; slower growth, sourcing shifts, and policy uncertainty weighed on volumes
- Country of origin: China imports weakened; Southeast Asia gained share, partially offsetting declines elsewhere
- Regional demand: Asia-to–U.S. East Coast stronger than West Coast; West Coast outlook: January capacity from Far East expected +10.4% vs. December; blanked capacity down 48.5%; East Coast outlook: 162,219 TEUs of blanked capacity announced for the first eight weeks of 2026
- Carrier strategy: Capacity managed differently by coast, reflecting stronger East Coast demand and West Coast sensitivity to U.S.–China tensions
Impact on Freight Rates
- Spot rates on Shanghai to Los Angeles surged 26% to $3,132 per 40ft container and those from Shanghai to New York increased 20% to $3,957 per 40ft container. Capacity rose 7–10% MoM on both Asia–North American routes, while anecdotal information points to soft volumes from Asia to the US, indicating that these large increases appear opportunistic and unlikely to last long.
- USA container freight prices in January 2026 show a generally competitive market with falling rates from December, driven by overcapacity, though carriers attempt rate hikes for Lunar New Year demand, creating volatile spots around $2,000-$3,400 for 40ft containers from Asia to US coasts, with West Coast ports cheaper than East Coast, but expect fluctuation as carriers manage capacity and pre-Chinese New Year.
Outlook
- We expect lower overall import volumes in 2026, with early months seeing year-over-year declines due to softer economic conditions and ongoing trade policy impacts. Carriers are using blank sailings and service adjustments to balance oversupply, keeping rates pressured despite some potential short-term spikes. The outlook going into 2026 sees a more favorable environment for shippers due to ample capacity and weaker demand.
- Container import volumes at major U.S. ports are expected to remain below year-ago levels through at least May, as slowing global trade growth, economic headwinds, and ongoing policy uncertainty weigh on demand, according to forecasts released this week. For the maritime industry, the outlook points to a year defined by fragile demand and shifting trade patterns as tariff battles and economic uncertainty continue to reshape global shipping.
Ocean freight trends - South America
- The South American shipping market closed 2025 in a state of resilient tension. While the region benefited from a record-breaking year in specific terminals - notably Porto Itapoá reaching 1.5 million TEUs - the broader landscape was defined by high operational pressure and seasonal volatility.
- The Port of Cartagena (Colombia) has reached a historic milestone by handling 4 million TEUs in 2025, consolidating its position as the port with the highest container traffic in the region and the most efficient in the Americas.
- Record Volume Growth: Brazil’s port sector outpaced global averages, with key terminals seeing growth of up to 25% year-on-year. This was driven by a booming e-commerce sector (projected to hit $200 billion by 2026) and a diversification of export portfolios in Brazil and Chile.
- Service Reliability: The TANGO and SEAS services remained the backbone of East Coast South America (ECSA) trade, maintaining reliable schedules despite increasing yard utilization.
- Climate & Geopolitics: The Panama Canal drought continued to influence West Coast South America (WCSA) logistics, forcing some carriers to maintain alternative routings or pay high auction fees for priority transit.
Main Reasons for Bottlenecks
- ECSA Port Congestion: Terminals in Santos, Paranaguá, and Itapoá faced high yard occupancy levels (often exceeding 80%). Berthing delays of roughly 4 days were common in December for vessels arriving off-schedule.
- Infrastructure Gaps: Brazil’s installed handling capacity is struggling to keep pace with demand. Average container dwell times in Santos reached up to 10 days during peak December windows.
- Operational Disruptions: Weather-related closures in the Southern region (Rio Grande and Montevideo) and cruise season traffic in Buenos Aires added complexity to vessel rotations.
- Customs & Red Tape: Administrative bottlenecks and "paper-heavy" processes remained a structural hurdle, particularly in cross-border operations within the Southern Cone.
Impact on Freight Rates & Dynamics
- MSC has published the increased Detention and Demurrage rates to be applied from January onwards. This applies for Brazilian ports as well.
- A General Rate Increase (GRI) implemented in late 2025 held steady. Average rates from China to ECSA saw a modest upward trend in December as space became fully utilized
- Global spot rates rose by approximately 12% in mid-December. For South America, this was less about global scarcity and more about "local premiums" caused by port congestion surcharges and peak season demand.
- Peak Season Surcharges (PSS) were active for most carriers through December, though some started signaling a postponement of further increases until late January 2026.
Outlook
- Analysts project a 25% drop in global average spot rates for 2026 as massive new vessel capacity (approx. 1.8 million additional TEUs) enters the market. South America will likely see more competitive freight negotiations by Q2 2026.
- The "2026 Playbook" for regional shippers will shift from pure cost-cutting to supply chain resilience, focusing on alternative gateways (e.g., Northern Arc ports in Brazil) to bypass traditional bottlenecks
Ocean freight trends - Middle East
- CMA CGM has resumed selected Suez transits, while Maersk and other liners continue a cautious, conditional return. Re-entry remains phased and lane-specific, with some services still routing via Cape of Good Hope. This is easing extreme diversions but capacity restoration remains uneven.
- Strong throughput continued into December at Gulf hubs, supported by restocking, project cargo movements, and deferred volumes from earlier disruptions. Qatar ports maintained solid momentum following the November surge, while Jebel Ali and Dammam experienced peak-season pressure.

Main Reasons for Bottlenecks
- Misalignment in carrier schedules and selective service resumptions continue to create congestion at key transhipment hubs, particularly where Red Sea and Cape-routed networks intersect.
- Localised shortages of 40’ HC equipment persist in parts of the Middle East and ISC markets, driven by uneven box repositioning and late-year demand surges.
- Peak-season occupancy levels remain high, limiting short-term storage options. Haulage capacity is tight in several markets due to driver availability and holiday-period slowdowns.
- Expect 2–3 days port congestion for BB cargo at major regional ports including Jeddah, Dammam, and Jebel Ali, driven by berth productivity constraints and yard density
Impact on Freight Rates
- Some Asia–Middle East and ISC lanes remain firm due to capacity discipline and equipment constraints, while others show stabilisation or mild softening as additional sailings return. Rate dispersion across carriers is pronounced.
- War-risk and contingency surcharges are being selectively reviewed and adjusted, but reductions are inconsistent. Insurers and carriers remain cautious pending sustained Red Sea stability.
- Overall moderation continues, supported by capacity, but urgent, time-sensitive, and specialised cargo still commands premiums, especially during December peak cut-off windows.
- Short-term upward pressure persists on warehousing, detention, and last-mile delivery due to high utilisation and limited availability.
Outlook (30-90 days)
- Further reopening of Suez/Red Sea routings is expected, but carriers will continue to stagger deployments.
- Capacity should improve progressively through Q1 2026; however, episodic congestion, equipment tightness, and short-lived rate/surcharge spikes are likely to continue on select lanes until schedules fully stabilise.
Ocean freight trends - South Africa
- South African container terminals handled an average of 11,851 TEUs daily, down from 11, 10,780 TEUs at the end of last year.
- Failed GRIs: Carriers have been unable to sustain General Rate Increases (GRIs) due to weak demand, leading to persistent downward pressure on freight rates.
- Oversupply Gap: Container demand (TEU-miles) continues to lag behind fleet growth, signaling a multi-year struggle with excess capacity.
Main Reasons for Bottlenecks
- More than 50 operational hours were conceded at the Port of Cape Town early January due to adverse weather.
- Adverse weather, system issues, as well as equipment breakdowns and shortages, prevented optimal performance in Durban.
- Vacant berths and adverse weather ensured operational delays at our Eastern Cape Ports.
- Adverse weather conditions and marine equipment challenges proved to be the primary.
Impact on Freight Rates
- Global freight rates increased for the first time in four weeks, with the “World Container Index” (WCI) up by ↑6,7% (or $121) to $1 927 per 40-ft container (end 2025).
- The most notable increases were to the US, with spot rates from Shanghai to Los Angeles climbing ↑8% to $2 256, while those to New York rose ↑6% to $2 895. Elsewhere, the charter market remains stable, with the Harpex Index trading at 2 181 points.
Outlook
- Regional Standouts: Africa and East Asia are leading the charge in performance, with South–South trade (trade between developing economies) rising by 8%.
- Sub-Saharan Africa: Despite a slight monthly dip in late 2025, the region shows strong annual resilience with imports up 9.9% and exports up 8%.
Customer advice
Considering the ever-changing market conditions and forces, please:
- Let's closely monitor the developments in the US trade policy and the impending world events to maneuver potential challenges effectively in the logistics industry.
- Plan ahead in anticipation on CNY and Ramadan 2026 and related capacity constraints.
- Think ahead and book well in advance. Try to plan for 6 months ++.
- Consider that the market can change significantly. Further disruptions can happen anytime.
- Identify contract options that enable flexibility and resilience for your business.
- Plan 3–4 weeks in advance for all Asia-related cargo.
- Consider alternative European gateways or routings where feasible.
- Maintain flexible delivery schedules to absorb delays.
- Stay engaged for tactical rate and space guidance.
However, it is our job at Bertling to keep global supply moving and do all we can and apply our knowledge, network and expertise to protect our clients’ while taking the latest market developments into account. We are there to find the best solutions to ensure cargo flows.


