


Europe
Asia Pacific
North America
South America
Middle East
South Africa
Executive Summary
Transpacific spot rates plateaued at extreme levels in October, while Asia to Europe found a floor and turned upward despite returning Suez capacity. Xeneta data put Far East to US West Coast at USD 8,348 per FEU on 28 October, with a forward view of USD 8,401 for 4 November, and Far East to North Europe at USD 3,712, rising to USD 3,754 in the forward view. For lanes not covered in that dataset, Xeneta's weekly update of 23 October put Far East to US East Coast at USD 11,525 per FEU, more than 330% above the pre-Hormuz crisis level of 28 February, and Far East to Mediterranean at USD 4,442 per FEU after a 5.8% weekly gain. The Transpacific followed the plateau we expected in September, while Asia to Europe bottomed earlier than our base case assumed.
Three forces shaped the month. The Strait of Hormuz saw its most violent month since the war began, including the sinking of the container feeder GFS Pride in mid-October. The Red Sea return accelerated, with Xeneta measuring weekly capacity crossing Bab el-Mandeb at 448,273 TEU on 5 October, double the late August level. And bunker costs broke through USD 1,000 per tonne for VLSFO in Singapore. The key takeaway: door-to-door costs are rising everywhere because of congestion, inland fuel surcharges and dwell times, whatever the port-to-port direction.
Global Economic & Trade Context
The Middle East conflict that began on 28 February remains the largest cost driver. Al Jazeera, citing UK Maritime Trade Operations, reported at least 12 ship attacks in the week to 16 October, the highest weekly count of the war. Transport Intelligence notes the IMF (International Monetary Fund) assumes the strait will not reopen before March 2027. Brent reached USD 116.54 per barrel on 30 October according to ENGINE.
Trade policy offers a temporary reprieve. USTR (Office of the United States Trade Representative) proposed on 26 October to extend the suspension of Section 301 port fees on China-linked vessels from 9 November 2026 to 9 January 2027.
In the US, the NRF (National Retail Federation) Global Port Tracker of 8 October projects imports of 2.25 million TEU in October falling to 2.0 million TEU in November, with 2026 totalling 25.8 million TEU, up 1.4%. EIA put US on-highway diesel at USD 6.352 per gallon on 26 October, up from USD 6.199 on 5 October.
Container Freight Market Analysis
Spot Rate Developments
| Index / Lane | Latest figure + date | Direction / interpretation |
| Xeneta Far East - US West Coast |
USD 8,348 (28 Oct) / 8,401 (4 Nov, forward view) |
+0.6%; flat at high level |
| Xeneta Far East - North Europe | USD 3,712 (28 Oct) / 3,754 (4 Nov, forward view) | +1.1%; upward momentum continuing |
| Xeneta North Europe - US East Coast | USD 2,955 (28 Oct) / 2,928 (4 Nov, forward view) | –0.9%; stable |
| Xeneta short-term, Far East - ECSA |
USD 5,211 (28 Oct) / 5,087 (4 Nov, forward view) |
–2.4%; easing |
| Xeneta North Europe – South America East Coast | USD 921 (28 Oct) / 880 (4 Nov, forward view) | –4.5%; weak backhaul |
| Drewry WCI Composite |
USD 4,429/40ft (29 Oct) |
USD 4,429/40ft (29 Oct) |
| Drewry Shanghai - Los Angeles |
USD 7,514/40ft (29 Oct) |
–6% w/w; softening |
| Drewry Shanghai - New York |
USD 9,631/40ft (29 Oct) |
–5% w/w; softening |
| Drewry Shanghai - Rotterdam |
USD 3,686/40ft (29 Oct) |
+1% w/w; stabilising |
| Drewry Shanghai - Genoa |
USD 4,151/40ft (29 Oct) |
Stable |
| Drewry Intra-Asia Container Index |
USD 1,504/40ft (29 Oct) |
+USD 46 w/w; around 200% above a year ago |
Freightos reported on 28 October that FBX Asia to US East Coast rose 9% to USD 10,565 per FEU, a 2026 high, with Asia to US West Coast at USD 8,368, Asia to North Europe at USD 3,551 and Asia to Mediterranean at USD 4,252.
Carrier Strategies
FAK: MSC published Far East FAK rates on 29 October, valid 15 to 30 November, of USD 4,600 per 40ft to North Europe, USD 5,300 to the West Mediterranean and USD 5,700 to the East Mediterranean. That targets roughly 24% above Xeneta's North Europe average of USD 3,712 on 28 October. Drewry doubts November increases will hold given available capacity.
PSS: Maersk applies USD 2,000 per 40ft from Far East Asia to South Africa from 9 November and USD 1,000 per container from the East Coast of South America to North America from 5 November. CMA CGM introduced Asia to Africa PSS of USD 300 to 900 per TEU from 1 November.
Fuel and emergency charges: Maersk raises its US and Canada Emergency Intermodal Fuel Surcharge from 16 November to USD 350 per dry import container.
Blank sailings: Drewry's tracker of 13 October listed 34 blanks out of 713 sailings for weeks 42 to 46, a 5% rate, half on Asia to Europe. Xeneta counted 58,200 TEU blanked on Far East to US West Coast and 35,500 TEU to the East Coast in mid-October.
Allocation control and rollings: Sea-Intelligence's arrival-based schedule reliability was 50.6% in September with late vessels averaging 6.65 days behind schedule, so rollings at origin and bunching at destination remain routine.
Breakbulk & Project Cargo Segment
Toepfer Transport's TMI for a 12,500 dwt F-type heavy-lift vessel rose 1.49% to USD 13,023 per day in October, the first reading above USD 13,000 since May 2025, while the TMI-500 for F500 tonnage reached USD 17,782 per day. Toepfer reports positive sentiment driven by demand for project-capable MPP tonnage.
OOG angle: Containerised OOG on flat racks and open tops is priced off FAK levels plus premiums, so it inherits spot volatility and is rolled first when ships are full. With multi-day berthing waits at Yangshan and irregular arrivals in North Europe, flat rack availability and transhipment windows are the real constraint. For heavy or dimensionally critical units, a direct MPP call avoids transhipment risk at a stable charter cost. Bertling assesses that the crossover has shifted towards breakbulk for units beyond standard flat rack payloads to the Middle East and Africa, where container PSS levels are highest.
Regional Insights – Deep Dive
Ocean freight trends - Europe
Main Market Trend
Asia to Europe rates reversed their summer decline. Xeneta's Peter Sand cites 12.2% demand growth on Far East to Europe in the first seven months as the reason rates rise despite returning Suez capacity.
Main Reasons for Bottlenecks
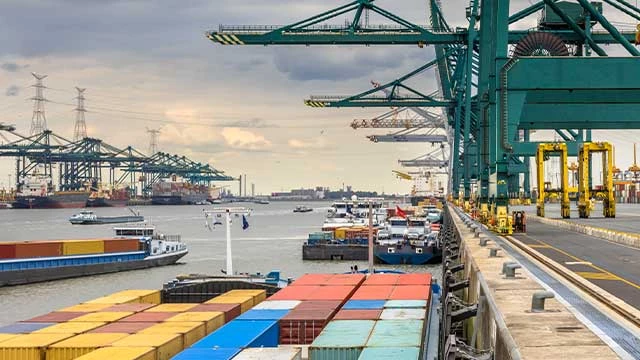
Freightos reported on 28 October that vessels arriving ahead of schedule are bunching and slowing port recovery, as ships on the shorter Suez routing reach North European hubs alongside vessels still on Cape rotations. Sea-Intelligence's arrival-based reliability of 50.6% in September shows how irregular arrival patterns remain.
Impact on Freight Rates
Irregular arrivals disrupt barge and rail slot planning, pushing hinterland cargo onto road at short notice and higher cost, while late vessels compress free time at busy terminals.
Rate impact: Bertling expects modest Asia to Europe increases in early November, with partial FAK success at best.
Ocean freight trends - Asia Pacific
Main Market Trend
Asia outbound pricing remained firm across all corridors. Drewry's Intra-Asia index rose to USD 1,504 per 40ft on 29 October, and Shanghai to Jebel Ali stood at USD 8,584 per 40ft.
- Strong Asia–US demand; weaker Asia–Europe demand.
- Congestion, overcapacity and schedule disruptions persist.

Main reason for bottlenecks
Typhoon Champi struck on 23 October, triggering anchorage restrictions in Zhejiang, Fujian and Shanghai. Portuaria reported berthing waits of 4 to 7 days at Yangshan, 1 to 2.5 days at Waigaoqiao and 1.5 to 3 days at Ningbo on 23 October, while Drewry noted that Shanghai congestion had been easing before the storm.
Impact on Freight Rates
Congestion absorbs effective capacity and supports rates. For door-to-door shipments, empty release and cut-off reliability at origin matter as much as the rate, particularly for transhipment cargo.
- Asia-US: Strong but may soften.
- Asia-Europe: Potential rate declines.
- Intra-Asia: Mixed market.
- Middle East: Highly volatile.
Rate impact: Bertling expects Asia outbound rates to stay stable at elevated levels, with weather and congestion as upside risks.
Softer demand, excess capacity and operational disruptions keep the market volatile.
Ocean freight trends - North America
Main market trend
Asia to North America rates plateaued at historic highs. Xeneta judges that the post-Hormuz peak has passed and expects a correction rather than a collapse, with the East Coast falling harder. The NRF projects November imports down 1% year on year.
Main reason for bottlenecks
FreightWaves reported on 28 October that 35,688 import containers were awaiting rail at Los Angeles and Long Beach on 26 October, of which 10,562 had been on terminal for nine days or longer.
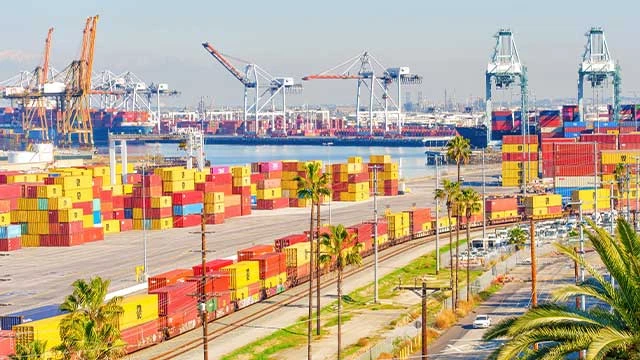
Pacific Merchant Shipping Association data put average rail dwell at 7.19 days in September, up from 6.75 days in August. ILWU Local 26, representing around 250 watchmen at terminals handling about 85% of Long Beach and 33% of Los Angeles cargo, authorised a strike from 1 November. The Pacific Maritime Association announced on 30 October that talks are extended to 4 November.
Impact on Freight Rates
Port-to-port rates are easing, but door-to-door costs are moving the other way through higher intermodal fuel surcharges, diesel above USD 6.30 per gallon and detention exposure from rail dwell. A strike would halt gates and yards at affected terminals immediately.
Rate impact: Bertling expects Transpacific spot rates to drift lower in November while inland costs keep landed cost elevated.
Ocean freight trends - South America
Main market trend
Asia to South America East Coast is easing from a high level, according to Xeneta data with a forward view to 4 November, while the North Europe backhaul is soft. Northbound, Maersk's PSS to North America signals tight capacity.
Main reason for bottlenecks
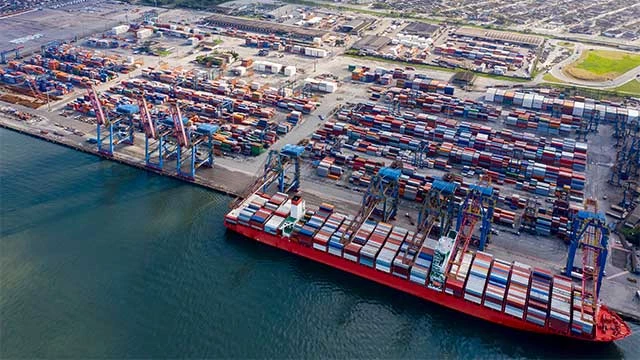
DatamarNews reported on 15 October that container ships missing their window wait two to three days, while the Tecon Santos 10 expansion remains stalled.
Impact on Freight Rates
Santos sits 450 to 500 km from key production areas, so a missed vessel means terminal storage cost rather than a return inland. Exporters should plan truck slots around actual vessel arrival.
Rate impact: Bertling expects Asia to South America rates to soften gradually while northbound costs firm on surcharges.
Ocean freight trends - Middle East
Main market trend
Port-to-port rates into the Gulf have passed their peak but remain far above pre-war levels. Transport Intelligence reports the SCFI Persian Gulf and Red Sea index at 4,035 points on 8 October, below its 24 September high of 4,180. Xeneta data cited by Transport Topics on 30 October still show China to Khor Fakkan spot rates 442% and China to Jeddah 214% above pre-war levels as of 23 October.
Capacity is returning to gateways outside the strait: Linerlytica reports that Maersk and Hapag-Lloyd resumed a regular weekly Asia service calling Khor Fakkan from 17 October, and that MSC extended an Asia to India service to Khor Fakkan and Sohar with a first call on 18 October.
Main reason for bottlenecks
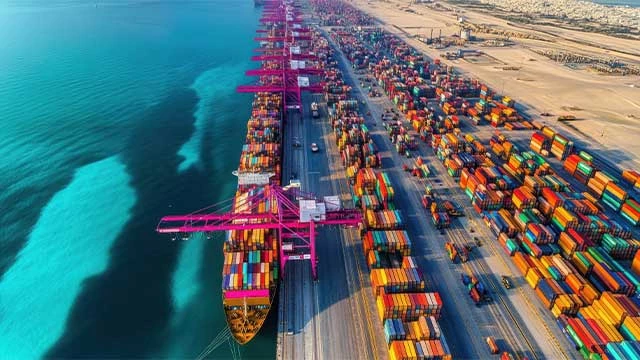
With Hormuz closed to most container traffic, cargo is discharged at Khor Fakkan, Fujairah, Sohar or Jeddah and trucked to its destination. Linerlytica describes congestion at Khor Fakkan and Sohar as severe. Transport Topics reports that DP World's truck network moves more than 3,000 containers a day for Jebel Ali free zone customers, a fraction of the roughly 40,000 a day the terminal normally handles.
Impact on Freight Rates
The cost burden has shifted from the ocean leg to the local leg. DP World's Yuvraj Narayan told Transport Topics that land routes are four to five times more costly than sea in some instances. Congestion adds waiting time, storage and detention, so door-to-door quotations rise even where the ocean component eases.
Rate impact: Bertling expects port-to-port Gulf rates to drift lower as carriers add capacity to Khor Fakkan and Sohar, while trucking, handling and congestion costs keep door-to-door costs at crisis levels.
Ocean freight trends - South Africa
Main market trend
Rates from Asia are rising through surcharges rather than base rates, with new Maersk and CMA CGM PSS in November.
Main reason for bottlenecks
Freight News reported on 20 October, citing the RSA Corridor Pulse Report, an average vessel wait of about 4 days and port calls above 7 days for seven consecutive weeks, and Maersk changed a SAECS rotation because of Pier 1 delays.
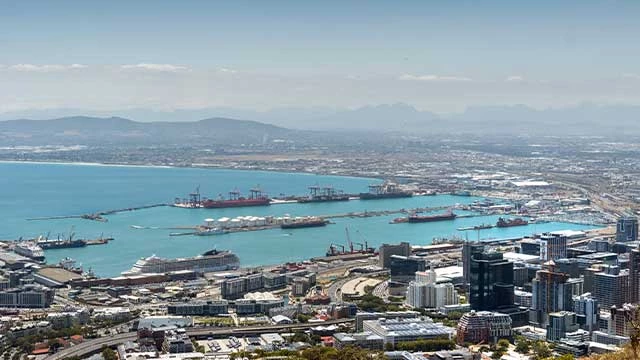
Daily Maverick reported on 18 October that the Durban Gateway Terminal, which handles almost half of national container freight, is still recovering from the mid-August IT system switch, with vessel delays averaging about 251 hours at anchorage.
Rate impact: Bertling expects all-in Asia to South Africa costs to rise in November on PSS and congestion.
Impact on Freight Rates
Omissions push cargo to Cape Town or Ngqura and onto road or rail, while long berthing delays erode free time and raise detention risk for project shipments with fixed site windows.
Rate impact: Bertling expects all-in Asia to South Africa costs to rise in November on PSS and congestion.
Operational Insights
Bunker supply is tightening: ENGINE reported VLSFO lead times of about 13 days in Singapore on 30 October and recommended 5 to 8 days in Houston.
Bunker prices (Go-Shipping indicative, 27 October 2026, USD/mt):
- Singapore: VLSFO 969, MGO 1,339
- Rotterdam: VLSFO 766, MGO 1,439
- Houston: VLSFO 835, MGO 1,430
- Fujairah: VLSFO 984, MGO 1,744
- Santos: VLSFO 898, MGO 1,703
- Global average (Bunker Index BIX World, 30 October): VLSFO 980.21, MGO 1,590.98
ENGINE assessed Singapore VLSFO at USD 1,002 per tonne on 30 October, up USD 28 in one day.
Surcharge implications: VLSFO East of Suez trades around USD 200 above Rotterdam. Bertling expects BAF revisions and emergency fuel charges to rise further on Asia origin services from December, with smaller Atlantic increases. Fujairah MGO at USD 1,744 per tonne also lifts feeder costs in the Gulf.
Market Outlook & Strategic Recommendations
Base scenario: Transpacific spot rates ease gradually through November as volumes drop, Asia to Europe holds most of its October gain without full FAK success, bunker stays near current levels and Hormuz remains closed to most container traffic. This is Bertling's assessment, not a sourced forecast.
Upside scenario: A Hormuz settlement after the US midterms would cut fuel costs quickly and unlock Gulf ports. Combined with a completed Red Sea return, this would bring a sharp correction into 2027 tender season.
Downside scenario: Escalation after 3 November, a Bab el-Mandeb incident reversing the Suez return, a Long Beach terminal stoppage or lapse of the Section 301 fee suspension would push rates and surcharges higher at short notice.
Strategic recommendations: Benchmark all-in cost rather than ocean rate, secure inland capacity before ocean space in the US and South Africa, and build index-linked mechanisms into 2027 contracts.
Key Takeaway
Geopolitics sets the ceiling, but congestion, fuel and inland friction set the real cost of moving cargo this autumn. Winners treat the Suez return as a 2027 pricing opportunity while protecting this quarter's shipments against hinterland and labour risk. Losers benchmark port-to-port rates and discover their landed cost too late.
Customer advice
The Red Sea return has moved from announcement to scale, so 2027 Asia to Europe tenders should not lock in Cape-based pricing for twelve months. Ask for quarterly review points or index linkage, and test whether quoted transit times already reflect Suez routings.
The Strait of Hormuz has become more dangerous, and the loss of a container feeder shows that war risk now hits box cargo directly. For Gulf deliveries, ask carriers which discharge port they will actually use, because the switch from Jebel Ali to Khor Fakkan changes customs, cargo insurance and consignee arrangements.
Cost pressure has also shifted inland. In the US, rail dwell, a possible Long Beach stoppage and higher intermodal fuel surcharges matter more for November budgets than the ocean rate, while Durban delays make Cape Town or Ngqura worth costing now. Project shippers with fixed site dates should build typhoon buffers into Asian origin schedules and verify flat rack availability at the transhipment hub before committing.
Disclaimer: This report is based on publicly available market intelligence and represents analysis as of 30 September 2026. Forward-looking statements reflect base-case assumptions and are subject to risks outlined in the Market Outlook section. Actual market conditions may vary. For questions or custom analysis, contact Bertling Market Intelligence.


